Russell 2000 Forecast This Week — Outlook, Drivers & Key Levels
This week's Russell 2000 outlook: key drivers, volatility context, risk-opportunity assessment and the week ahead.

Market Overview
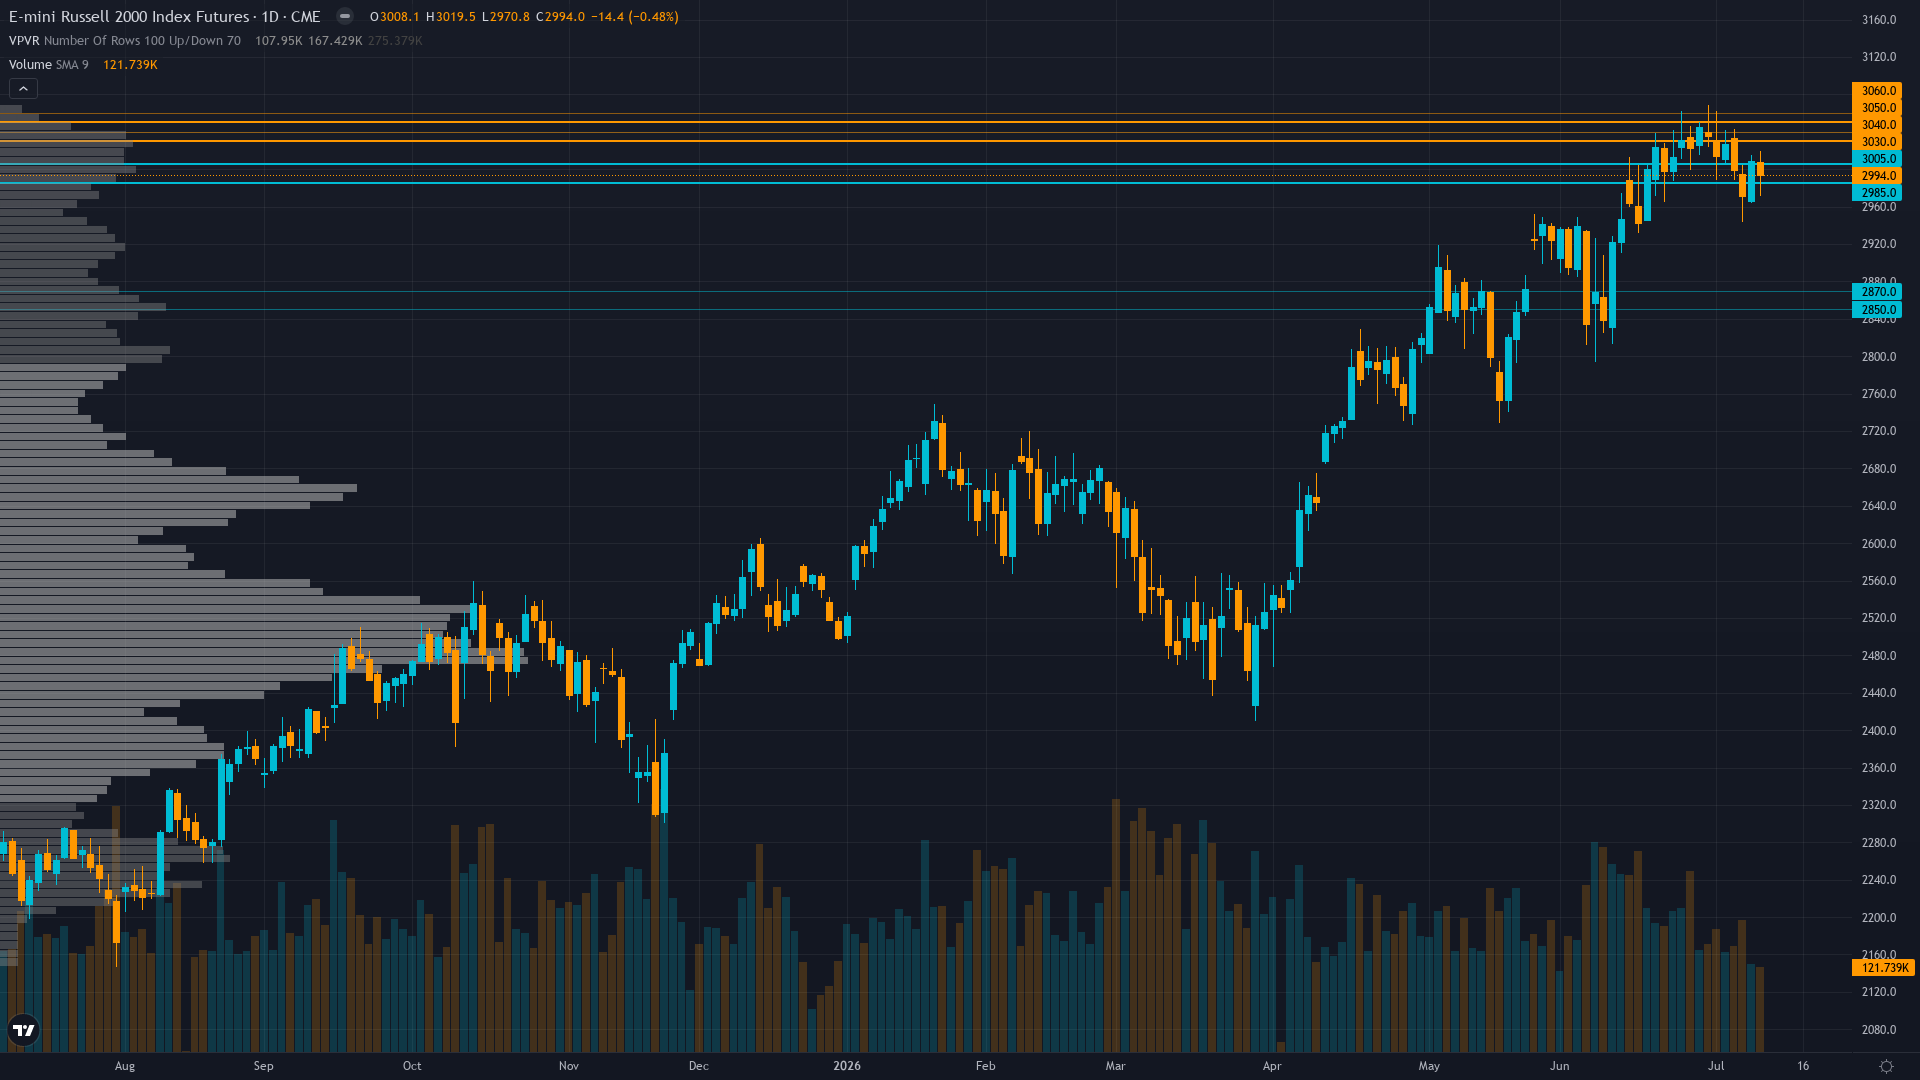
Russell 2000 sits at 2994.8 after slipping 0.95% — a shallow pullback rather than a decisive move. Russell 2000 futures is range-bound and tightening, with decreasing volatility signalling a directional resolution ahead.
Small-caps consolidating near July 1 all-time high at 3,049.9 with market celebrating record $45B YTD inflows and 2026 small-cap rotation narrative, maintaining constructive outlook on Q2 earnings validation beginning mid-July
Upside & Downside
Primary risk: Continued labor market deterioration validating June NFP weakness triggers Fed policy error recognition, forcing removal of hawkish bias and creating 5-8% correction toward 2,750-2,800 support as credit-sensitive RTY constituents reprice tightening financial conditions into weakening domestic growth backdrop (Probability: high)
Primary opportunity: July 28-29 FOMC delivers dovish pivot acknowledging June employment collapse and removes hike language, triggering relief rally targeting retest of 3,020-3,050 resistance as rate-sensitive small-caps benefit from easing financial conditions expectations (Timeframe: 16 days through July 28-29 FOMC meeting)
This week's edge: Market consensus celebrating July 1 ATH and record institutional inflows may be severely underpricing significance of catastrophic June NFP miss (10 days old) creating policy-data mismatch with Fed's hawkish posture, while desk recognizes acute vulnerability for credit-sensitive small-caps where 40% carry floating-rate debt into environment where Fed shows 22% July hike probability despite domestic employment collapse—consensus focused on past strength while underweighting fresh labor weakness catalyst
Key Drivers This Week
Primary driver: June NFP catastrophic miss (57k vs 110k consensus on July 2, just 10 days ago) with household employment collapsing -507k represents fresh negative catalyst contradicting Fed Chair Warsh's hawkish June 17 pivot, creating acute policy-data mismatch for credit-sensitive small-caps
Secondary factor: Technical deterioration confirmed with price falling 50 points from July 1 ATH of 3,049.9 to current 2,995, while breadth collapsed to 41.3% advancing vs 57.7% declining (July 9) and RSI 33.7 oversold creating failed breakout structure without bullish divergence
Additional influence: Severe discipline conflict with Economic (-2.5, conf 7) and Technical (-1.5, conf 6) decisively BEARISH contradicting Institutional (2.5, conf 6) and Options (1.5, conf 7) bullish positioning, while Fundamental and Sentiment show only mildly bullish leans creating analytical uncertainty
Economic backdrop: TRANSITIONAL regime moving toward RISK-OFF: June NFP catastrophic miss at 57k vs 110k consensus (July 2 release, 10 days ago) with household employment -507k contradicts Fed Chair Warsh's June 17 hawkish pivot showing 22% July hike probability, creating policy-data disconnect acutely problematic for rate-sensitive small-caps
Fundamental assessment: Q2 earnings season beginning mid-July provides validation opportunity for 17-44% growth expectations, but elevated forward P/E 18-25x creates vulnerability if results disappoint, while 40% of RTY constituents unprofitable with 40% floating-rate debt exposes credit sensitivity to hawkish Fed
Price Structure
Failed breakout structure with price at 2,995 trading 50 points below July 1 all-time high of 3,049.9, RSI 33.7 oversold without bullish divergence, breadth negative at 41.3% advancing creating deterioration despite consolidation near record levels
Trend strength at 4/10 paints a picture of a market with some direction but lacking strong conviction.
Volatility Regime
Volatility for RTY futures is at the 38th percentile over 90 days — a compressed regime where breakout potential builds beneath the surface. The vol trend is flat, with no meaningful shift across timeframes. Stable vol environments often lull traders before a regime change arrives.
Normal volatility regime at 38th percentile supports standard risk management with 2-3% stops below 2,860 support, expect 30-50 point daily ranges versus current 8-point compression suggesting volatility expansion likely as July FOMC approaches, stable pattern masking underlying fundamental tension between employment weakness and Fed hawkishness
What History Shows
small-cap futures enters July 2026 without a meaningful seasonal lean (50% win rate). Mid-year earnings season volatility.
The Week Ahead
Federal Reserve FOMC Meeting July 28-29 with statement July 29 critical for resolving policy-data contradiction between catastrophic June NFP miss and current 22% July hike probability per Polymarket, forward guidance decisive for credit-sensitive small-cap trajectory on Tuesday 28 July is a high-impact catalyst with the potential to redefine the near-term outlook entirely.
How Russell 2000 futures navigates the confluence of consolidating conditions and incoming data will determine whether the current directional thesis holds or breaks.
This analysis covers one dimension. Our full weekly report combines six specialist agents into a single actionable briefing with directional bias, key levels, and risk-opportunity matrix.
Start Free — Get the Market of the WeekFree weekly report · No credit card · Upgrade anytime



