Russell 2000 Forecast This Week — Outlook, Drivers & Key Levels
This week's Russell 2000 outlook: key drivers, volatility context, risk-opportunity assessment and the week ahead.

Where Things Stand
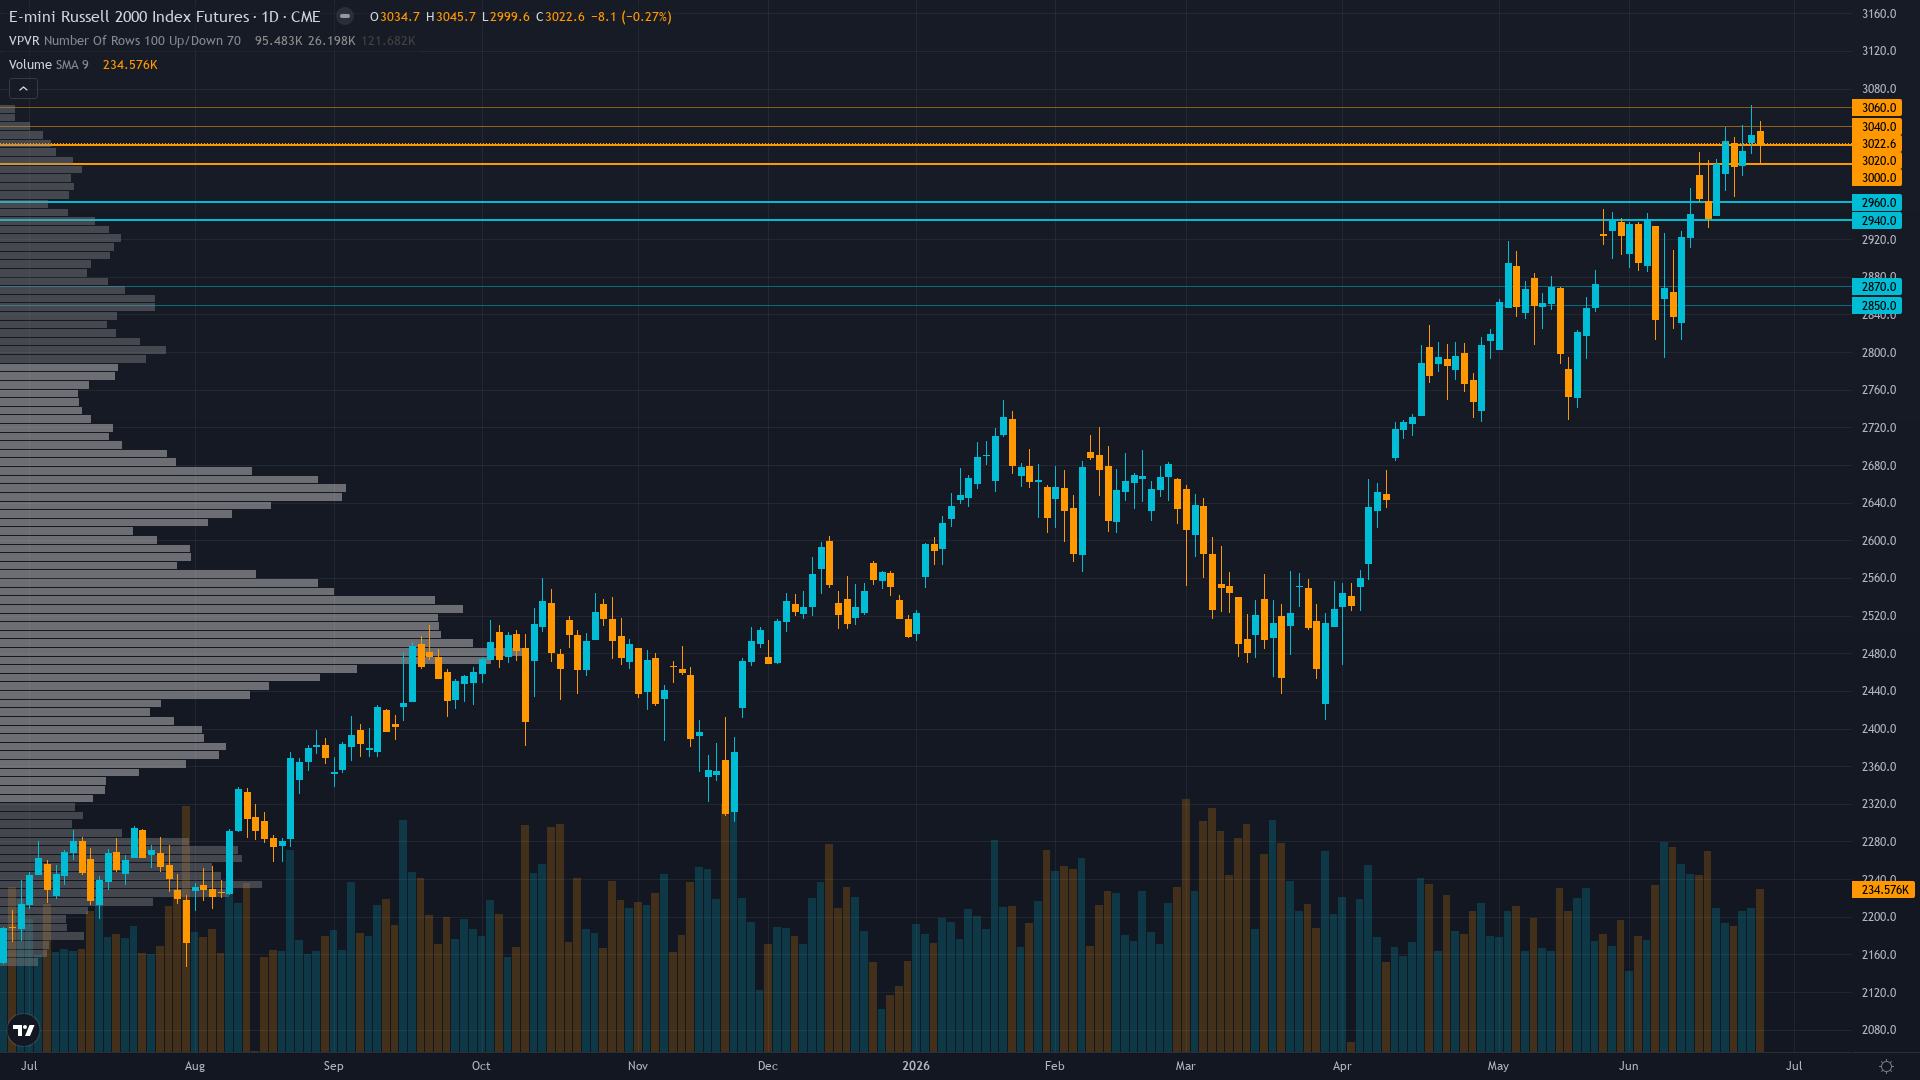
Russell 2000 holds at 2999.9, off 0.03% in a modest retracement from recent levels. Russell 2000 futures is consolidating, with price compressing into a narrower range as the market builds energy for its next move.
Small-caps consolidating near June 25 all-time high at 3,040 after Russell reconstitution completion June 26, market positioned for July 1 ISM Manufacturing data and mid-July Q2 earnings season to provide validation catalyst with Wall Street banks backing small-cap rotation narrative per recent Traders Union reporting
What's Driving Price
Primary driver: Russell reconstitution executed June 26 (2 days ago) completing the single largest annual institutional flow event with mechanical buying pressure now exhausted, while price consolidates 1.3% below June 25 all-time high of 3,040.1 creating post-catalyst directional uncertainty
Secondary factor: Fed Chair Warsh's June 17 hawkish pivot removing dovish forward guidance with dot plot showing 9 of 18 officials expecting 2026 rate hike creates fresh fundamental headwind for credit-sensitive small-caps carrying higher floating-rate debt exposure than large-caps
Additional influence: VIX at 18.41 well below 20 threshold with equity put/call at 0.67 showing complacent positioning despite consolidation 1.3% below ATH, while sentiment contrarian setup (Fear & Greed 25 Fear territory) creates mild bullish lean offset by Q2 earnings delivery risk beginning mid-July
Economic backdrop: RISK-ON macro regime with VIX 18.41 below 20 threshold, but Fed Chair Warsh's June 17 hawkish pivot removing dovish language and shifting dot plot to show 9 of 18 officials expecting 2026 rate hike versus 1 expecting cut creates fresh policy headwind for rate-sensitive small-caps though no immediate catalyst until July 30-31 FOMC 32 days away
Fundamental assessment: Q1 2026 earnings delivered 44.9% YoY growth validating inflection narrative, but forward P/E at 25.39x versus 13.62-17.34x historical range creates acute vulnerability if Q2 results beginning mid-July disappoint elevated bar with no fresh fundamental catalyst this week beyond completed reconstitution
Risk Environment
With vol at the 45th percentile over 90 days, RTY futures is in a measured regime that doesn't require unusual adjustments. Volatility is stable, with realised vol holding steady across timeframes. This equilibrium can persist but eventually resolves into expansion or contraction.
Normal volatility regime at 45th percentile supports standard risk management with 2-3% stops below 2900 support, expect 30-50 point daily ranges versus 60-100 during elevated volatility periods, stable pattern suggests consolidation environment until July 1 ISM Manufacturing catalyst or mid-July Q2 earnings provide directional clarity with recent narrow ranges confirming compression
Seasonal Context
Historically, June 2026 has been a headwind for small-cap futures, with seasonal data showing a 42% win rate. Summer doldrums typically hit small-caps harder.
Technical Landscape
Price at 2999.90 consolidating 1.3% below June 25 all-time high of 3,040.1 in tight 2995-3005 range, technical structure constructive with trend intact but momentum fading after three-session pullback from ATH creates near-term directional uncertainty
Trend strength registers at 7/10, suggesting meaningful but not extreme directional bias.
Risk-Reward Assessment
Primary risk: June 17 hawkish Fed pivot with dot plot showing 9 of 18 officials expecting 2026 rate hike removes small-cap easing narrative just as reconstitution flows exhaust, creating risk that forced mechanical support on June 26 proves insufficient to offset tightening financial conditions for credit-sensitive Russell 2000 constituents carrying 1.5x debt-to-equity versus 0.8x large-caps triggering 3-5% correction toward 2860-2900 support (Probability: medium)
Primary opportunity: Consolidation near June 25 ATH at 3,040.1 holds 2975-3000 support creating continuation structure targeting breakout above 3,040 resistance toward 3,100-3,150 measured extension if July 1 ISM Manufacturing data validates growth and Q2 earnings beginning mid-July confirm 44.9% trajectory, with sentiment contrarian setup at Fear & Greed 25 providing tactical bullish lean (Timeframe: 2-4 weeks through July 1 ISM data and early Q2 earnings releases beginning mid-July)
This week's edge: Market consensus celebrating June 25 ATH and successful reconstitution may be underpricing significance of June 17 Fed hawkish pivot (9 of 18 officials expecting 2026 hike versus 1 expecting cut) for credit-sensitive small-caps, while desk recognizes tactical tension between mechanical reconstitution support now exhausted and fundamental repricing of tightening financial conditions requiring reduced conviction at 5 given low-information-edge environment until July 1 ISM data provides fresh catalyst
What to Watch
ISM Manufacturing PMI release July 1 at 10:00 EDT will test whether strong manufacturing output from June 23 flash reading at 55.7 (49-month high) translates to employment or if productivity gains continue suppressing hiring, critical for small-cap domestic growth narrative (Wednesday 1 July) sits in the medium-impact category — unlikely to single-handedly shift the picture, but capable of adding directional fuel.
The interplay between consolidating market conditions and upcoming catalysts will define this week's trading landscape for Russell index.
This analysis covers one dimension. Our full weekly report combines six specialist agents into a single actionable briefing with directional bias, key levels, and risk-opportunity matrix.
Start Free — Get the Market of the WeekFree weekly report · No credit card · Upgrade anytime



