Russell 2000 COT & Institutional Positioning — Smart Money Analysis
Russell 2000 institutional positioning: COT data, sentiment analysis and smart money flow assessment.

Smart Money Positioning
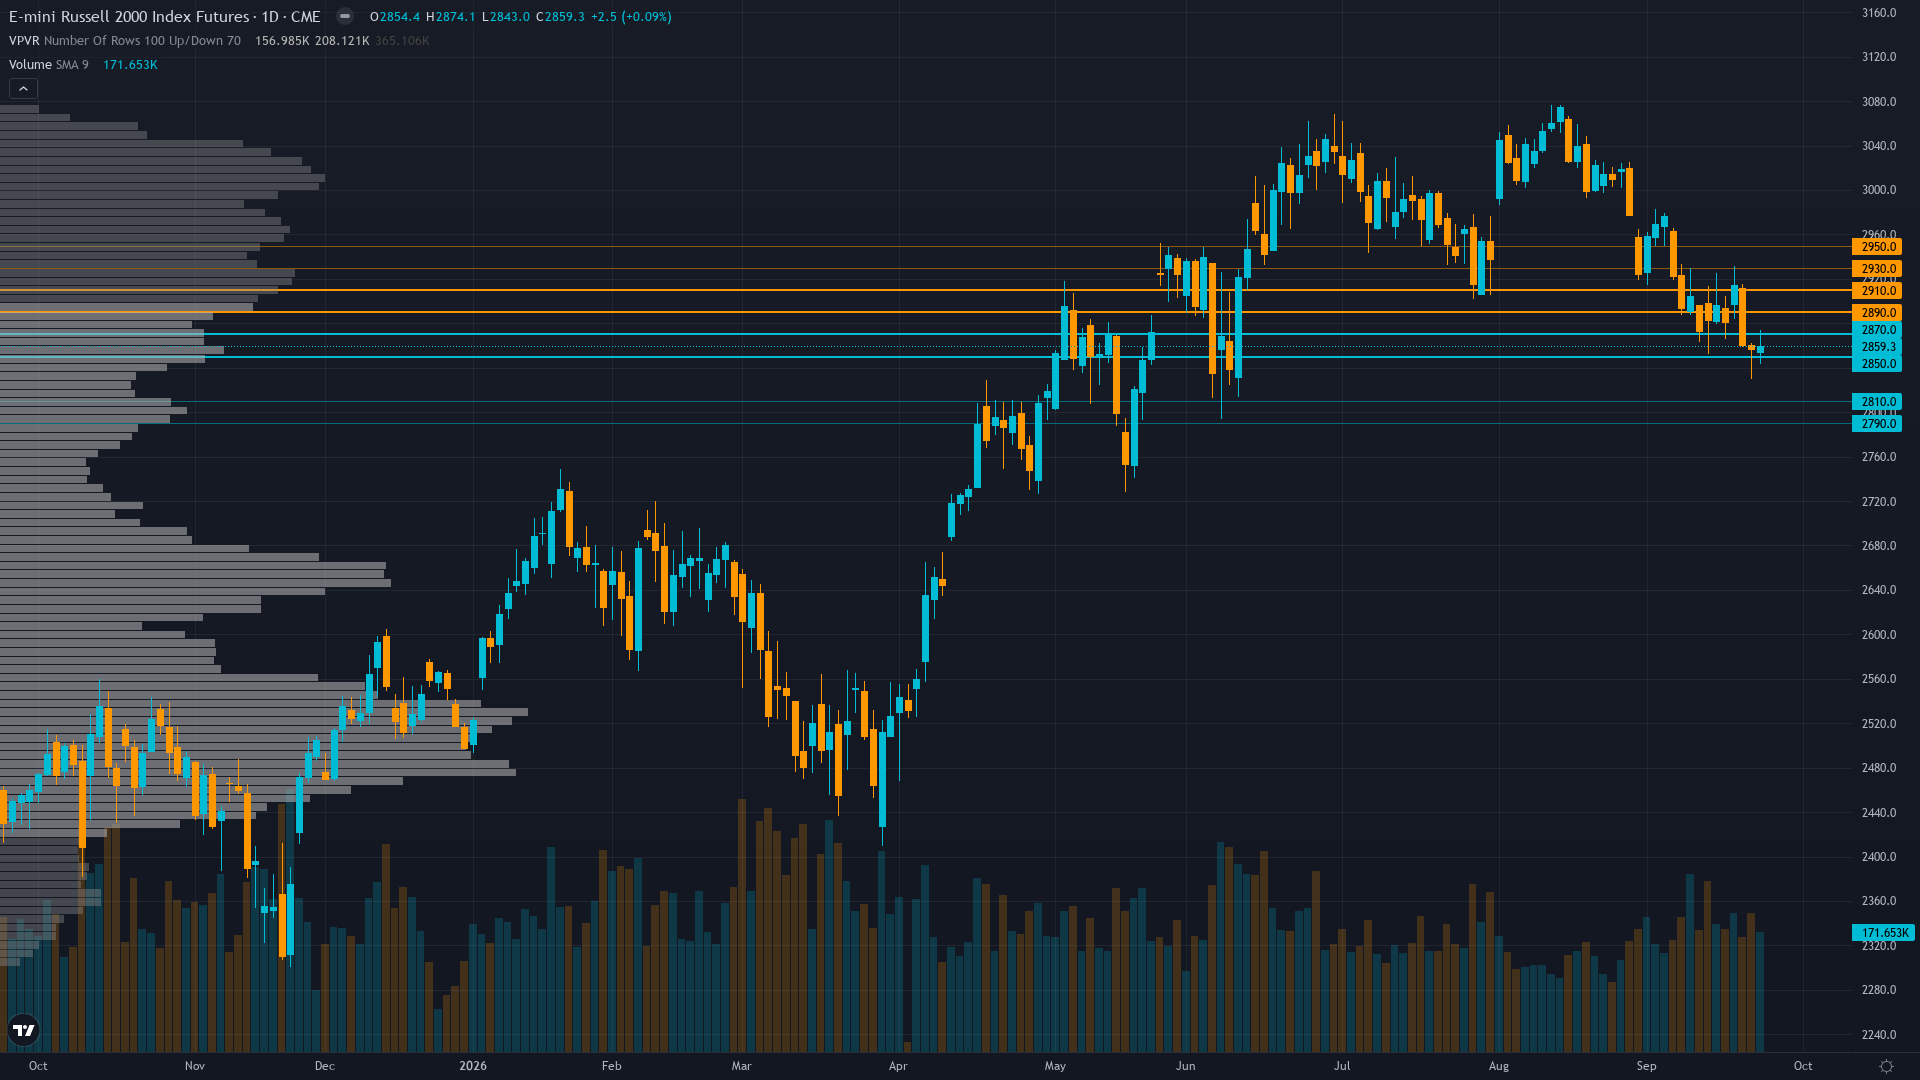
Russell 2000 sits at 2859.3 after slipping 0.28% — a shallow pullback rather than a decisive move.
Non-commercial net short -75,783 contracts as of Sep 22 (3.8th percentile of 3-year, -18.3% of OI), extreme bearish but reduced shorts by -3,433 contracts week-over-week as early covering begins into the ongoing decline — commercial traders net long 68,390 contracts providing the counterparty; the 3.8th percentile remains historically extreme and represents a powerful contrarian squeeze setup, though price action continues to show fundamental selling pressure overwhelming the covering dynamics, with the open interest at 415,047 contracts suggesting deep institutional engagement
Sentiment & Positioning
Sentiment around Russell 2000 futures is neutral, with no extreme positioning on either side. This balanced state often resolves when a catalyst breaks the equilibrium.
Options Market Signal
RTY ATM implied volatility at 14.5% (FlashAlpha Sep 21) modestly elevated relative to 20-day realized vol of 12.6% (pre-fetched data pack), indicating options are pricing slightly higher volatility than recent moves — VIX at 14.87 suggests broad equity volatility remains subdued, but FlashAlpha shows net gamma exposure of -$112.3M and call wall at $2,925, indicating bearish dealer positioning that could accelerate selling below key levels; the options market does not yet reflect the acute stress the COT extreme and credit spread widening suggest
Where We Agree & Diverge
Market consensus: Small-caps in an accelerating downtrend with sustained breakdown below 2900, driven by rising rates at 5.17% and widening credit spreads, though extreme speculative short positioning at the 3.8th percentile creates a squeeze setup that early covering activity (-3,433 contracts) has not yet overwhelmed
Primary driver: Sustained technical breakdown below 2900 psychological support with RTY at 2859.3, down -5.01% for September and -0.48% this past week, driven by 10Y Treasury yields surging to 5.17% (+16bp in 1W) — the highest since the late-August hawkish Jackson Hole repricing — creating acute headwinds for credit-sensitive small-cap balance sheets carrying floating-rate debt, with the 2s10s curve at +36bp confirming the steepening yield environment that is structurally negative for RTY as a credit instrument per Section 3 asset-specific context
Net Assessment
The institutional landscape for RTY futures shows fear sentiment. Trend strength registers at 7/10, suggesting meaningful but not extreme directional bias. The combination of positioning data, sentiment, and options flow provides context for understanding where smart money is leaning heading into the week.
This analysis covers one dimension. Our full weekly report combines six specialist agents into a single actionable briefing with directional bias, key levels, and risk-opportunity matrix.
Start Free — Get the Market of the WeekFree weekly report · No credit card · Upgrade anytime


