Russell 2000 COT & Institutional Positioning — Smart Money Analysis
Russell 2000 institutional positioning: COT data, sentiment analysis and smart money flow assessment.

Where Institutions Stand
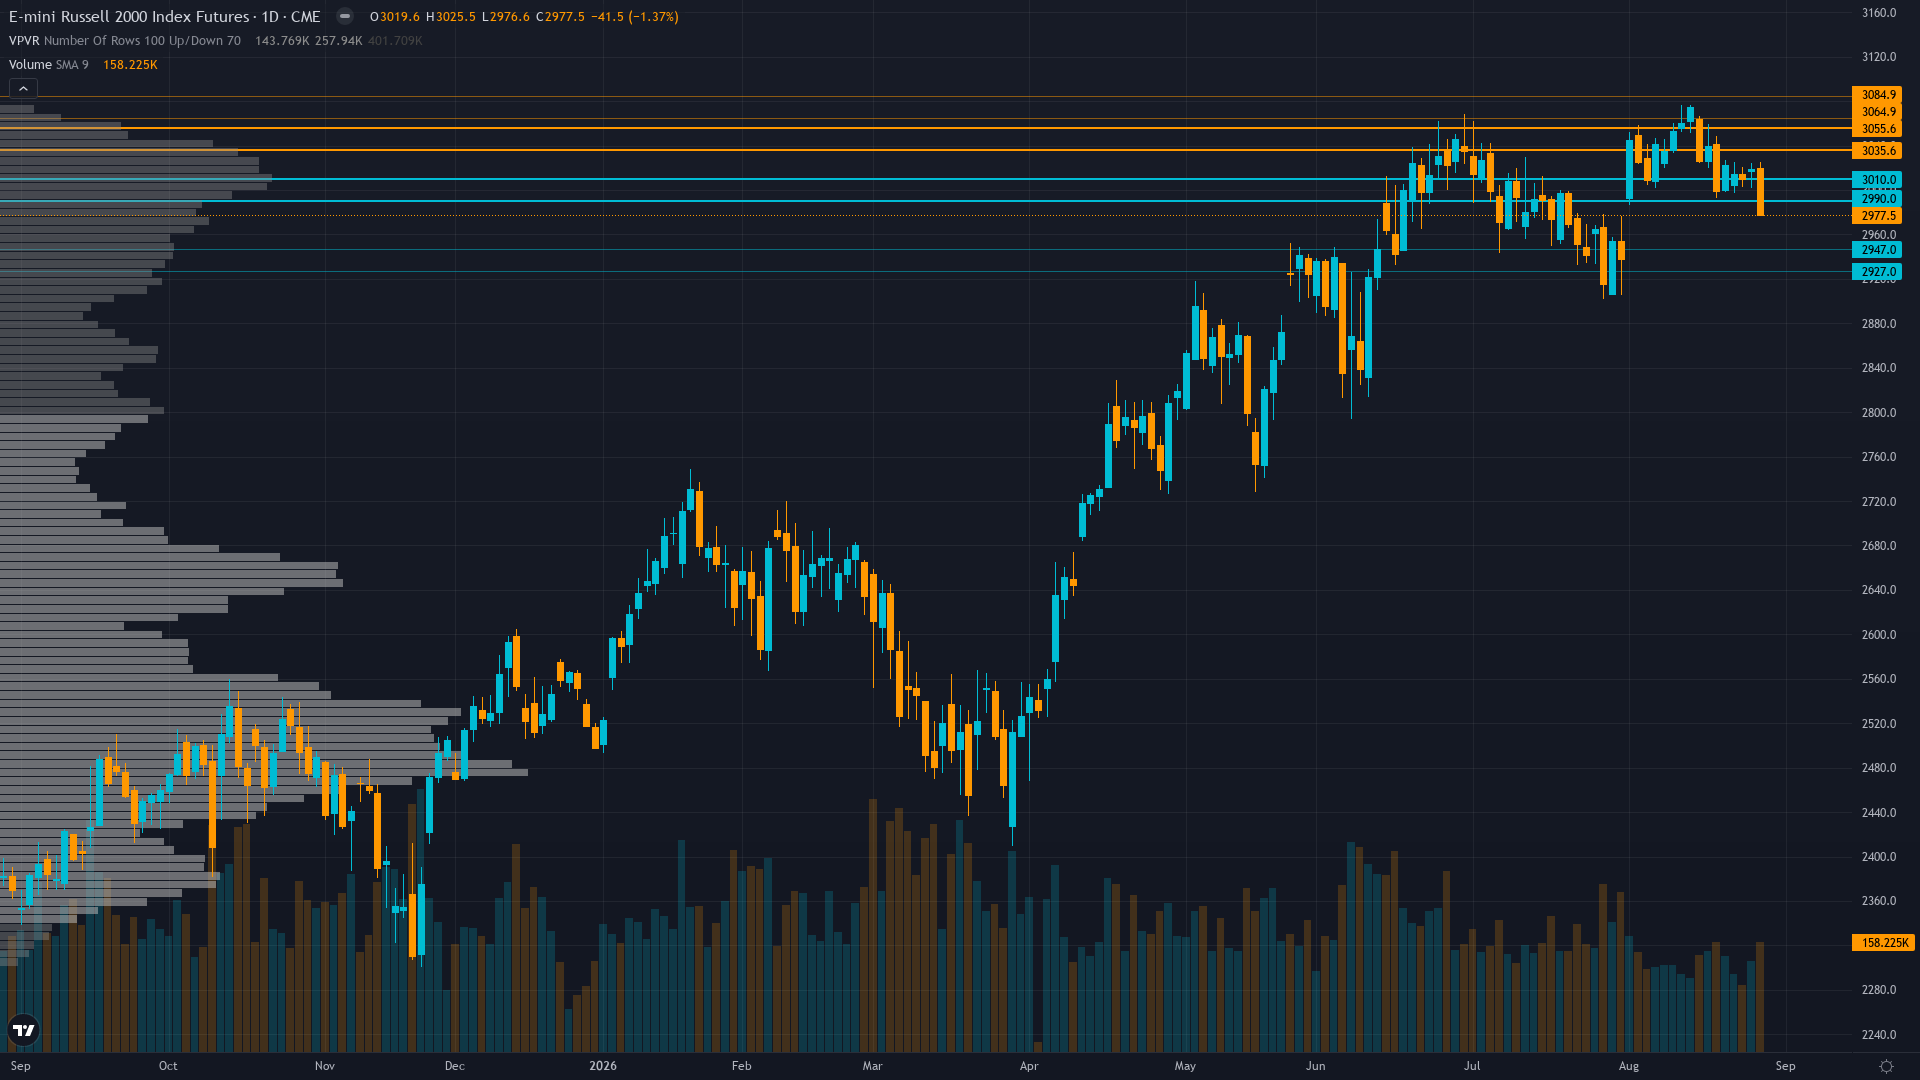
At 3018.9, Russell 2000 has eased 0.14% in a controlled retreat.
Non-commercial net short -51,578 contracts as of Aug 25 (24.1st percentile, -12.5% of OI), with -9,363 added shorts in the latest week — extreme positioning below the 25th percentile for 3 years, creating asymmetric squeeze potential but also reflecting informed bearish conviction into rate hike risk
Consensus vs MAD View
Market consensus: Small-caps in consolidation after Jackson Hole hawkish surprise with market pricing potential rate hike by year-end, awaiting ISM/ADP data this week for economic trajectory clarity
Primary driver: Fed Chair Warsh's Jackson Hole speech on August 28 opened the door to a potential rate hike (Oct-Dec timeframe), explicitly warning inflation remains too high at 2.31%, creating acute headwinds for credit-sensitive small-caps carrying floating-rate debt exposure — RTY dropped 1.39% on the speech day with RUT falling to 2,972.37, but has since recovered modestly to ~3,019 in Sunday pre-market
Where the Crowd May Be Wrong
The desk sees mild-to-moderate divergence from consensus: the market is pricing the Jackson Hole hawkish surprise linearly into small-cap weakness (RUT -1.39% on speech day), but may be underappreciating that the extreme speculative net short position at -51,578 contracts (24.1st percentile) creates asymmetric squeeze potential if ISM data prints benign on Sep 1, while also potentially underweighting the structural vulnerability of credit-sensitive small-caps to a rate hike cycle that the market has not yet fully repriced into 10Y yields at 4.73%
Crowd Psychology
Neither side has committed heavily to Russell 2000 futures, leaving sentiment in a neutral zone that offers little directional guidance on its own.
Options Flow
VIX at 14.44 remains in a low volatility regime near 52-week lows despite the Jackson Hole hawkish surprise, indicating market complacency about rate hike risk — RVX (Russell 2000 volatility index) last reported at 20.49 on July 31 but has likely declined since, creating a dangerous divergence between rising rate expectations and subdued options-market anxiety
The Bottom Line on Positioning
The positioning mosaic for Russell index combines neutral sentiment with stable volatility conditions. Trend strength is low at 3/10, indicating weak directional conviction and potential for range-bound behaviour. Taken together, institutional behaviour, crowd psychology, and derivatives data frame the setup heading into the new week.
This analysis covers one dimension. Our full weekly report combines six specialist agents into a single actionable briefing with directional bias, key levels, and risk-opportunity matrix.
Start Free — Get the Market of the WeekFree weekly report · No credit card · Upgrade anytime



