Russell 2000 COT & Institutional Positioning — Smart Money Analysis
Russell 2000 institutional positioning: COT data, sentiment analysis and smart money flow assessment.

Where Institutions Stand
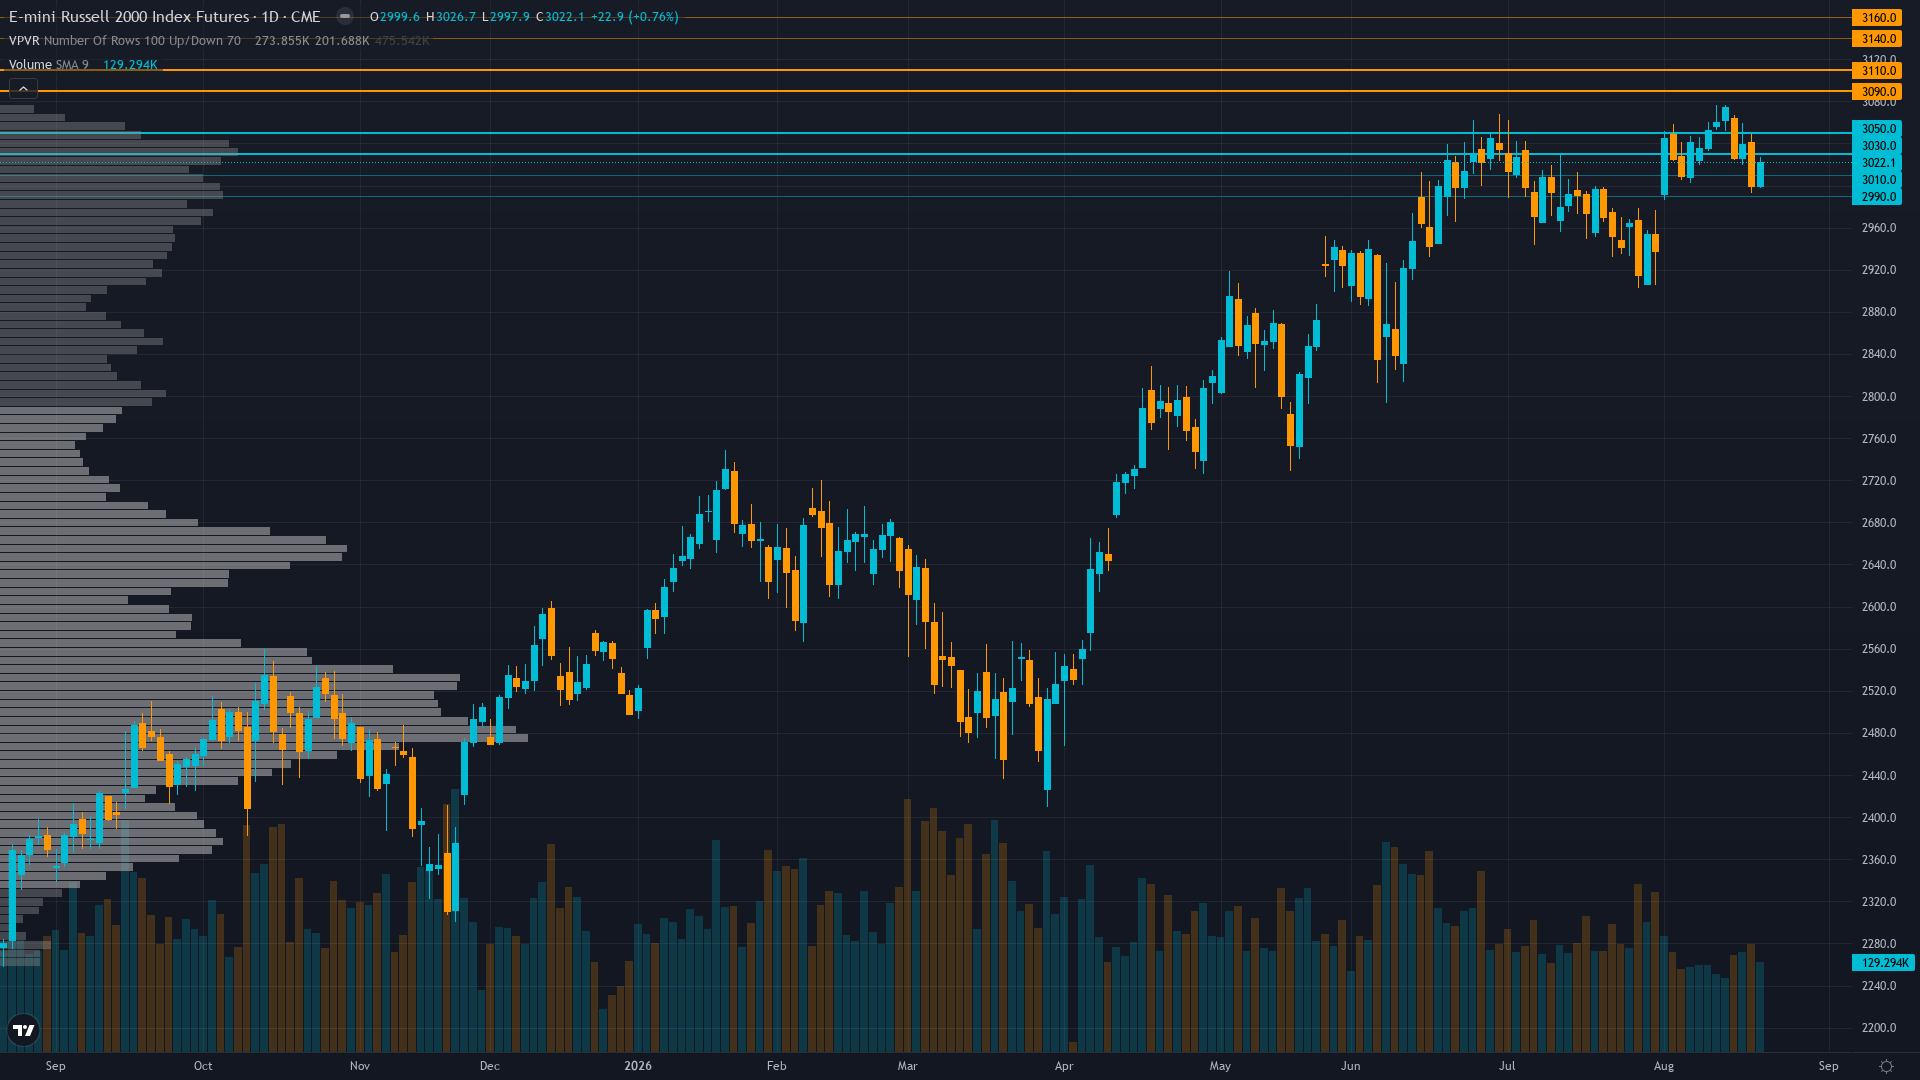
Russell 2000 holds at 3022.1, up a marginal 0.85% as the market grinds forward.
Non-commercial net short -42,215 contracts as of Aug 18 (28.5th percentile of 3-year range, -9.9% of OI), near multi-year extremes — contrarian squeeze potential intensifies as price pulls back from ATH with spec shorts still heavily positioned bearishly
Consensus vs MAD View
Market consensus: Small-caps consolidating after pullback from all-time highs with market awaiting PCE data for directional clarity, maintaining cautious neutrality as August seasonality and oversold conditions create competing narratives
Primary driver: RTY pulled back -1.71% last week from the Aug 17 all-time high at 3074.9 to close at 3022.1, consolidating above the psychological 3000 support after the ATH breakout failed to sustain, with oversold RSI conditions at 33.73 and extreme speculative net short positioning (-42,215 contracts, 28.5th percentile) creating a coiled spring setup
Where the Crowd May Be Wrong
Low divergence: NO CALL/neutral bias aligns with the market's cautious positioning ahead of PCE, and while the extreme speculative short position (28.5th percentile) combined with oversold RSI creates a contrarian setup, it does not rise to the level of a genuine blindspot given the Fundamental discipline's measured 55% reliability warning of valuation premium
Crowd Psychology
Neither side has committed heavily to Russell 2000 futures, leaving sentiment in a neutral zone that offers little directional guidance on its own.
Options Flow
RTY September options IV at 16.95% slightly above 20-day realized vol of 15.2%, VIX at 15.15 remains in low-volatility regime indicating complacency rather than fear — no extreme put/call signals detected, options market not pricing directional conviction despite the ATH pullback
The Bottom Line on Positioning
The positioning mosaic for Russell index combines neutral sentiment with stable volatility conditions. Trend strength sits at 4/10, reflecting moderate directional pressure without clear dominance. Taken together, institutional behaviour, crowd psychology, and derivatives data frame the setup heading into the new week.
This analysis covers one dimension. Our full weekly report combines six specialist agents into a single actionable briefing with directional bias, key levels, and risk-opportunity matrix.
Start Free — Get the Market of the WeekFree weekly report · No credit card · Upgrade anytime



