Russell 2000 COT & Institutional Positioning — Smart Money Analysis
Russell 2000 institutional positioning: COT data, sentiment analysis and smart money flow assessment.

Where Institutions Stand
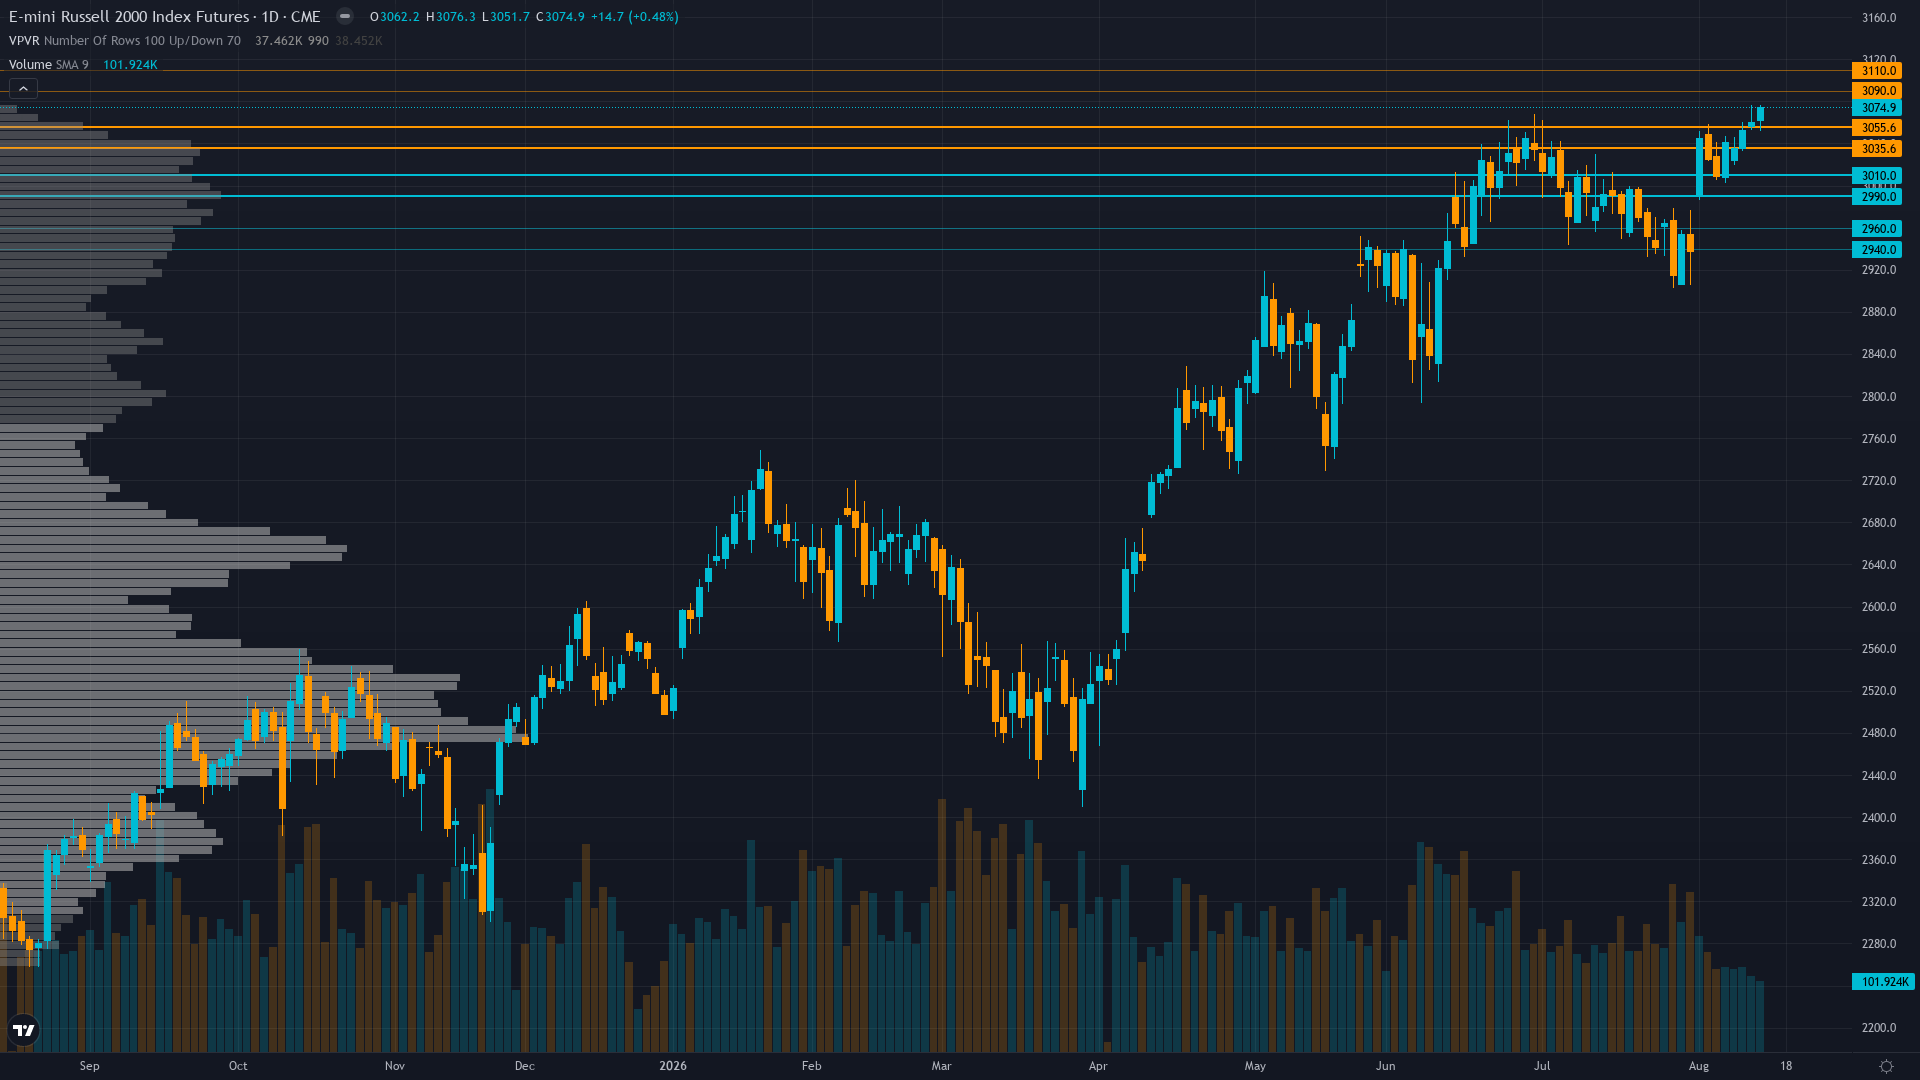
At 3074.9, Russell 2000 has inched 0.42% higher in a measured advance.
Non-commercial net short -42,304 contracts as of Aug 11 (28.5th percentile of 3-year, -10.1% of OI), with -7,577 added shorts week-over-week — contrarian squeeze setup intensifying as price breaks to all-time highs against growing speculative short positions
Consensus vs MAD View
Market consensus: Russell 2000 breaking out to all-time highs with strong momentum, supported by benign CPI, Fed hold expectations, compelling relative valuation vs large caps, and positive earnings revisions, though speculative short positioning at multi-year extremes creates squeeze risk
Primary driver: RTY breached to a new all-time high at 3,074.90 on August 14, confirming a breakout above the prior July 1 ATH at 3,045.6 and the Aug 12 CPI resistance level, as the benign CPI print (2.27% inflation rate per Aug 14 data) validated the disinflation narrative supporting rate-sensitive small-cap balance sheets carrying floating-rate debt exposure
Where the Crowd May Be Wrong
The desk sees moderate divergence from consensus as market pricing is focused on the benign macro breakout narrative while underweighting the extreme speculative net short positioning (-42,304 contracts, 28.5th percentile) that creates both squeeze upside and informed-selling downside risk that is not reflected in low VIX complacency at 14.55
Crowd Psychology
Neither side has committed heavily to Russell 2000 futures, leaving sentiment in a neutral zone that offers little directional guidance on its own.
Options Flow
VIX at 14.55 indicates low volatility environment with complacent positioning, RTY 20-day realized vol at 14.9% showing volatility compression, no extreme put/call signals detected — options market not pricing the squeeze risk that COT data suggests is growing
The Bottom Line on Positioning
The positioning mosaic for Russell index combines greed sentiment with stable volatility conditions. Trend strength registers at 7/10, suggesting meaningful but not extreme directional bias. Taken together, institutional behaviour, crowd psychology, and derivatives data frame the setup heading into the new week.
This analysis covers one dimension. Our full weekly report combines six specialist agents into a single actionable briefing with directional bias, key levels, and risk-opportunity matrix.
Start Free — Get the Market of the WeekFree weekly report · No credit card · Upgrade anytime



