Russell 2000 COT & Institutional Positioning — Smart Money Analysis
Russell 2000 institutional positioning: COT data, sentiment analysis and smart money flow assessment.

Where Institutions Stand
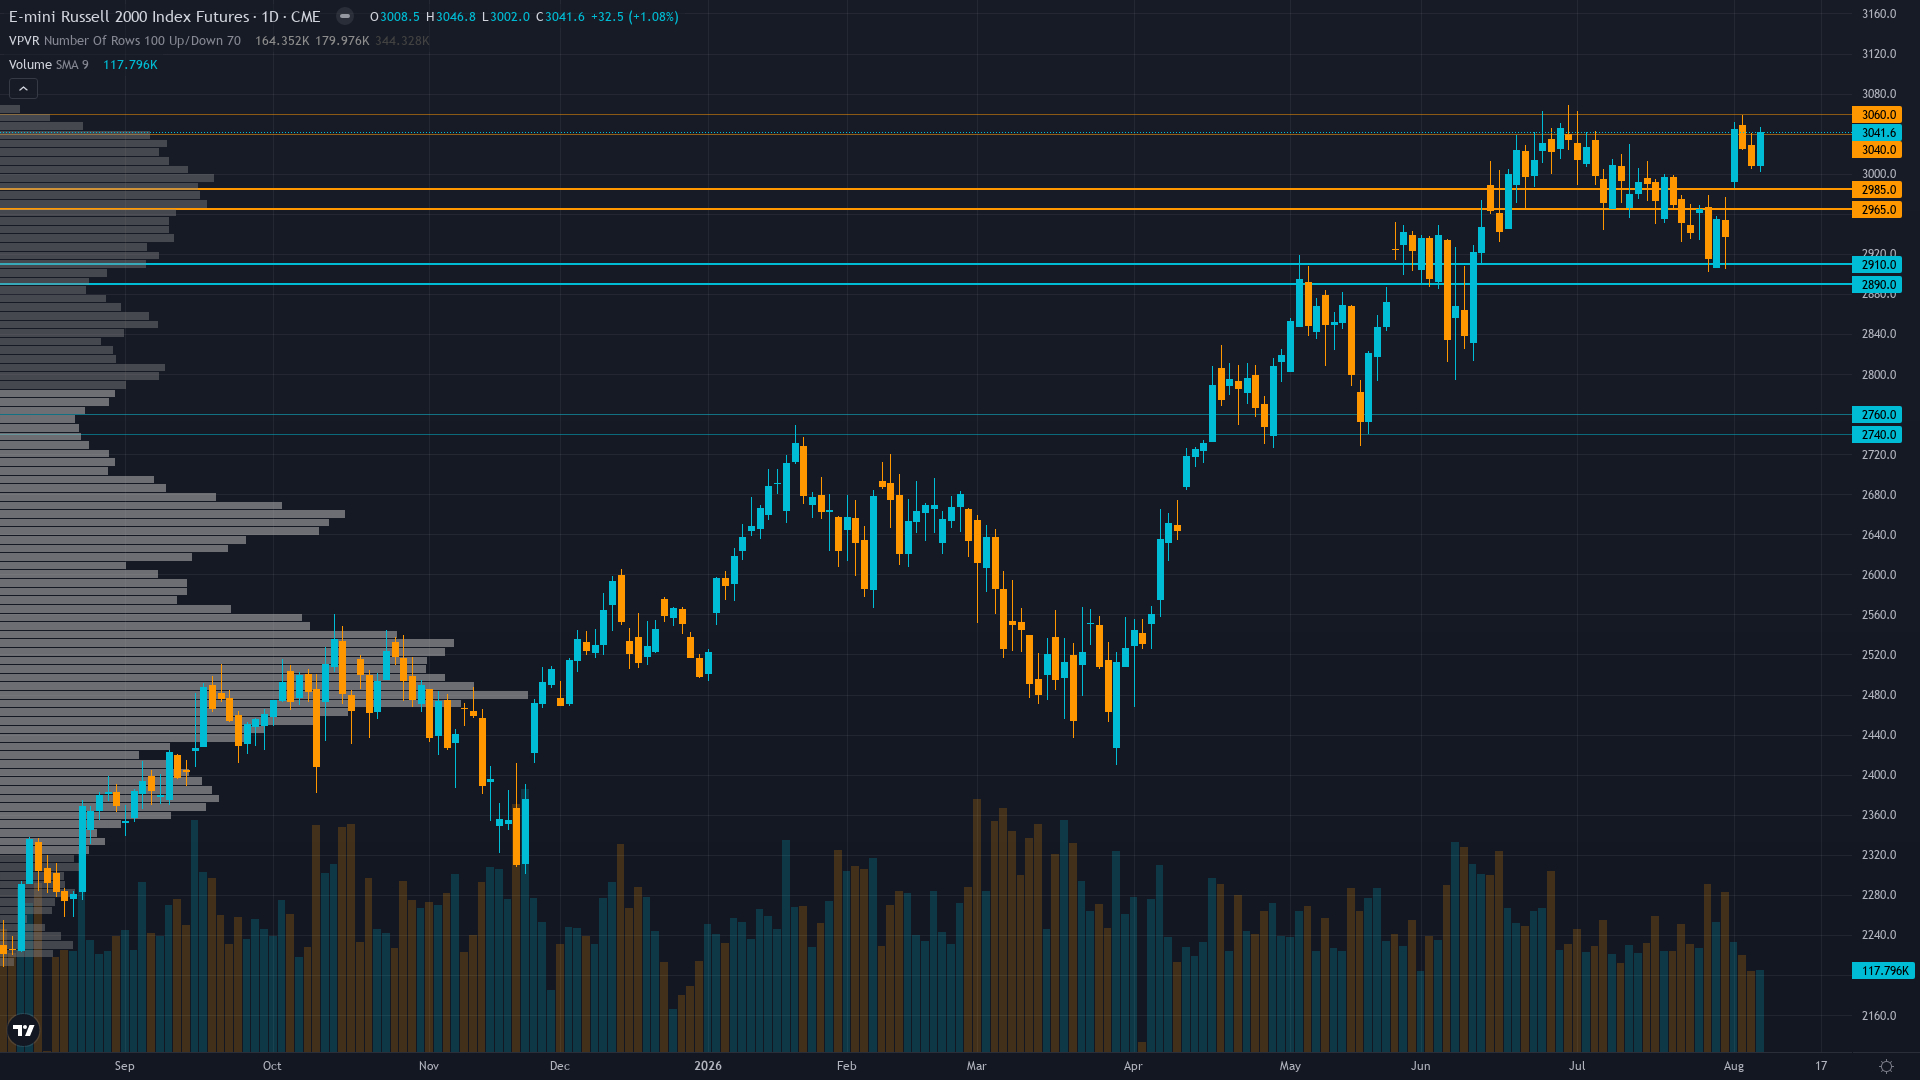
Russell 2000 stands at 3041.6001, having rallied 1.10% as bulls press their advantage.
Non-commercial net short -34,727 contracts as of August 4 (35.4th percentile of 3-year range), with a massive -18,458 contract bearish adjustment week-over-week, indicating speculative traders aggressively added shorts into the rally; IWM ETF flows showing mixed signals with no clear institutional accumulation pattern
Consensus vs MAD View
Market consensus: Small-caps recovering powerfully from July's correction, back within 0.13% of all-time highs, with market positioned for August 12 CPI to confirm disinflation and provide the catalyst for a breakout above 3045.6 resistance
Primary driver: RTY surged +3.53% last week from 2937 to 3040.4, recovering to within 0.13% of the July 1 all-time high at 3045.6, triggered by declining bond yields (10Y -10bp to 4.65%) and benign VIX at 15.15 as markets positioned for the critical August 12 CPI release forecasting continued disinflation at 3.4% YoY
Where the Crowd May Be Wrong
The desk sees mild divergence from consensus — the market is pricing a benign CPI-driven continuation rally, while the desk flags the tension between August-October seasonal headwinds and aggressive speculative short-selling (-18,458 contracts added last week) that suggests informed money is fading this rally, creating nuance the consensus may not be fully weighting
Crowd Psychology
Neither side has committed heavily to Russell 2000 futures, leaving sentiment in a neutral zone that offers little directional guidance on its own.
Options Flow
VIX at 15.15 indicates moderately low volatility environment below historical averages suggesting complacency; IWM put/call OI ratio of 2.61 suggests bearish hedging in the ETF while RTY-specific options data remains limited; RVX last reported at 20.49 on July 31 and has likely declined since given the rally, but small-cap-specific vol remains elevated relative to VIX
The Bottom Line on Positioning
The positioning mosaic for Russell index combines neutral sentiment with stable volatility conditions. Trend strength registers at 6/10, suggesting meaningful but not extreme directional bias. Taken together, institutional behaviour, crowd psychology, and derivatives data frame the setup heading into the new week.
This analysis covers one dimension. Our full weekly report combines six specialist agents into a single actionable briefing with directional bias, key levels, and risk-opportunity matrix.
Start Free — Get the Market of the WeekFree weekly report · No credit card · Upgrade anytime



