Russell 2000 COT & Institutional Positioning — Smart Money Analysis
Russell 2000 institutional positioning: COT data, sentiment analysis and smart money flow assessment.

Where Institutions Stand
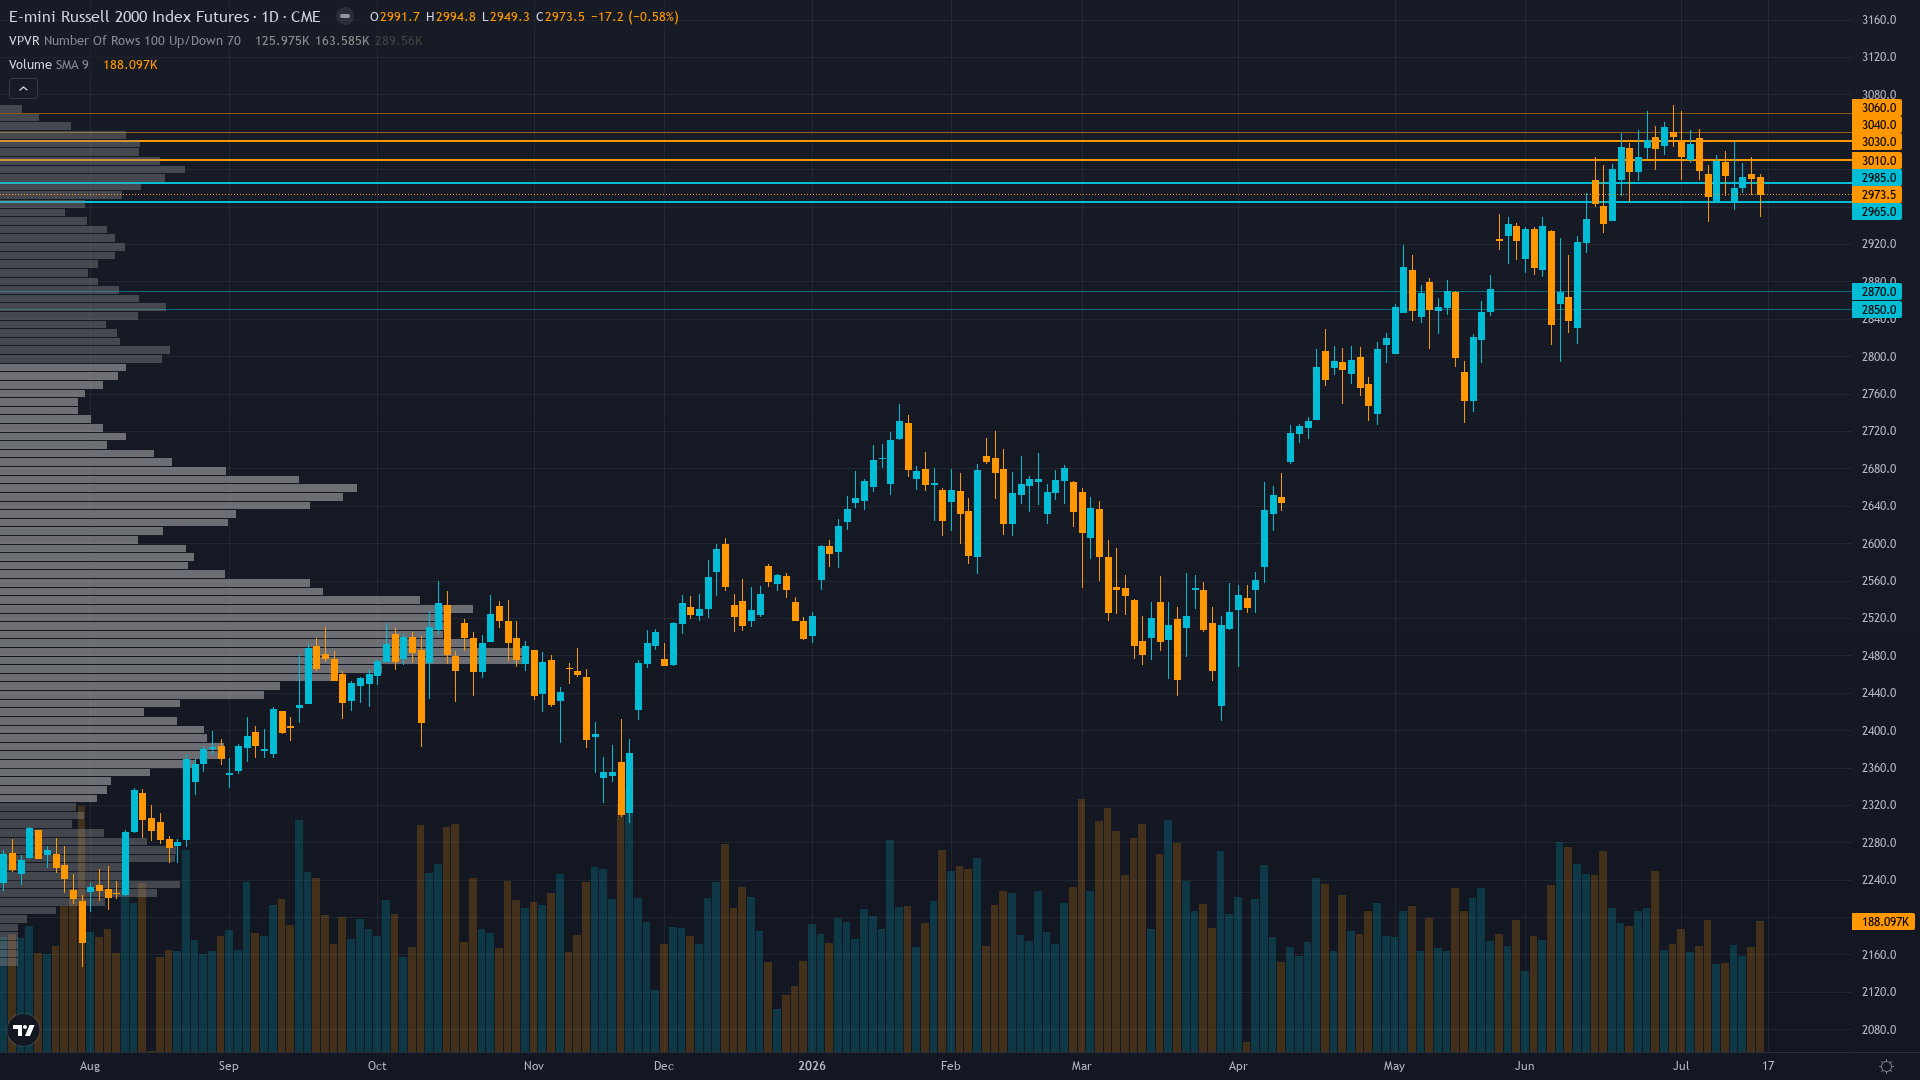
At 2986, Russell 2000 has inched 0.53% higher in a measured advance.
June 26 reconstitution flows fully exhausted after $11 trillion forced passive rebalancing completed, removing known mechanical bid while persistent IWM outflows of -$3.54B over trailing year show institutional distribution pattern continuing despite price resilience near all-time highs with stale COT data limiting real-time smart money visibility
Consensus vs MAD View
Market consensus: Small-caps consolidating 2% below July 1 all-time high at 3049.9 with market celebrating record H1 2026 performance (+22% best since 1991) and maintaining constructive outlook on Q2 earnings validation beginning mid-July, positioned for July FOMC to provide policy clarity
Primary driver: June NFP catastrophe (+57k vs 110k consensus, household employment -507k) released July 2 creates acute policy-data mismatch with Fed Chair Warsh's June 17 hawkish pivot showing 9 of 18 officials expecting 2026 rate hike, uniquely problematic for credit-sensitive small-caps carrying 40% floating-rate debt exposure
Where the Crowd May Be Wrong
Desk maintains BEARISH conviction 5 on June NFP catastrophe creating policy-data mismatch while market celebrates July 1 ATH with complacent sentiment (VIX spiking but put/call 0.73) and maintains elevated earnings expectations, creating moderate divergence as desk weights 17-day-old employment collapse and Fed hawkish pivot that consensus appears to be fading in favor of prior H1 momentum narrative and reconstitution flows already exhausted
Crowd Psychology
Neither side has committed heavily to Russell 2000 futures, leaving sentiment in a neutral zone that offers little directional guidance on its own.
Options Flow
VIX at 18.77 (up from 15.67 on July 16) shows material volatility expansion yet equity put/call remains complacent at 0.73, creating dangerous divergence where call demand dominates puts despite breakdown from ATH—historically precedes corrections when complacency persists amid rising volatility
The Bottom Line on Positioning
The positioning mosaic for Russell index combines neutral sentiment with stable volatility conditions. Trend strength sits at 4/10, reflecting moderate directional pressure without clear dominance. Taken together, institutional behaviour, crowd psychology, and derivatives data frame the setup heading into the new week.
This analysis covers one dimension. Our full weekly report combines six specialist agents into a single actionable briefing with directional bias, key levels, and risk-opportunity matrix.
Start Free — Get the Market of the WeekFree weekly report · No credit card · Upgrade anytime



