Russell 2000 COT & Institutional Positioning — Smart Money Analysis
Russell 2000 institutional positioning: COT data, sentiment analysis and smart money flow assessment.

The Institutional Landscape
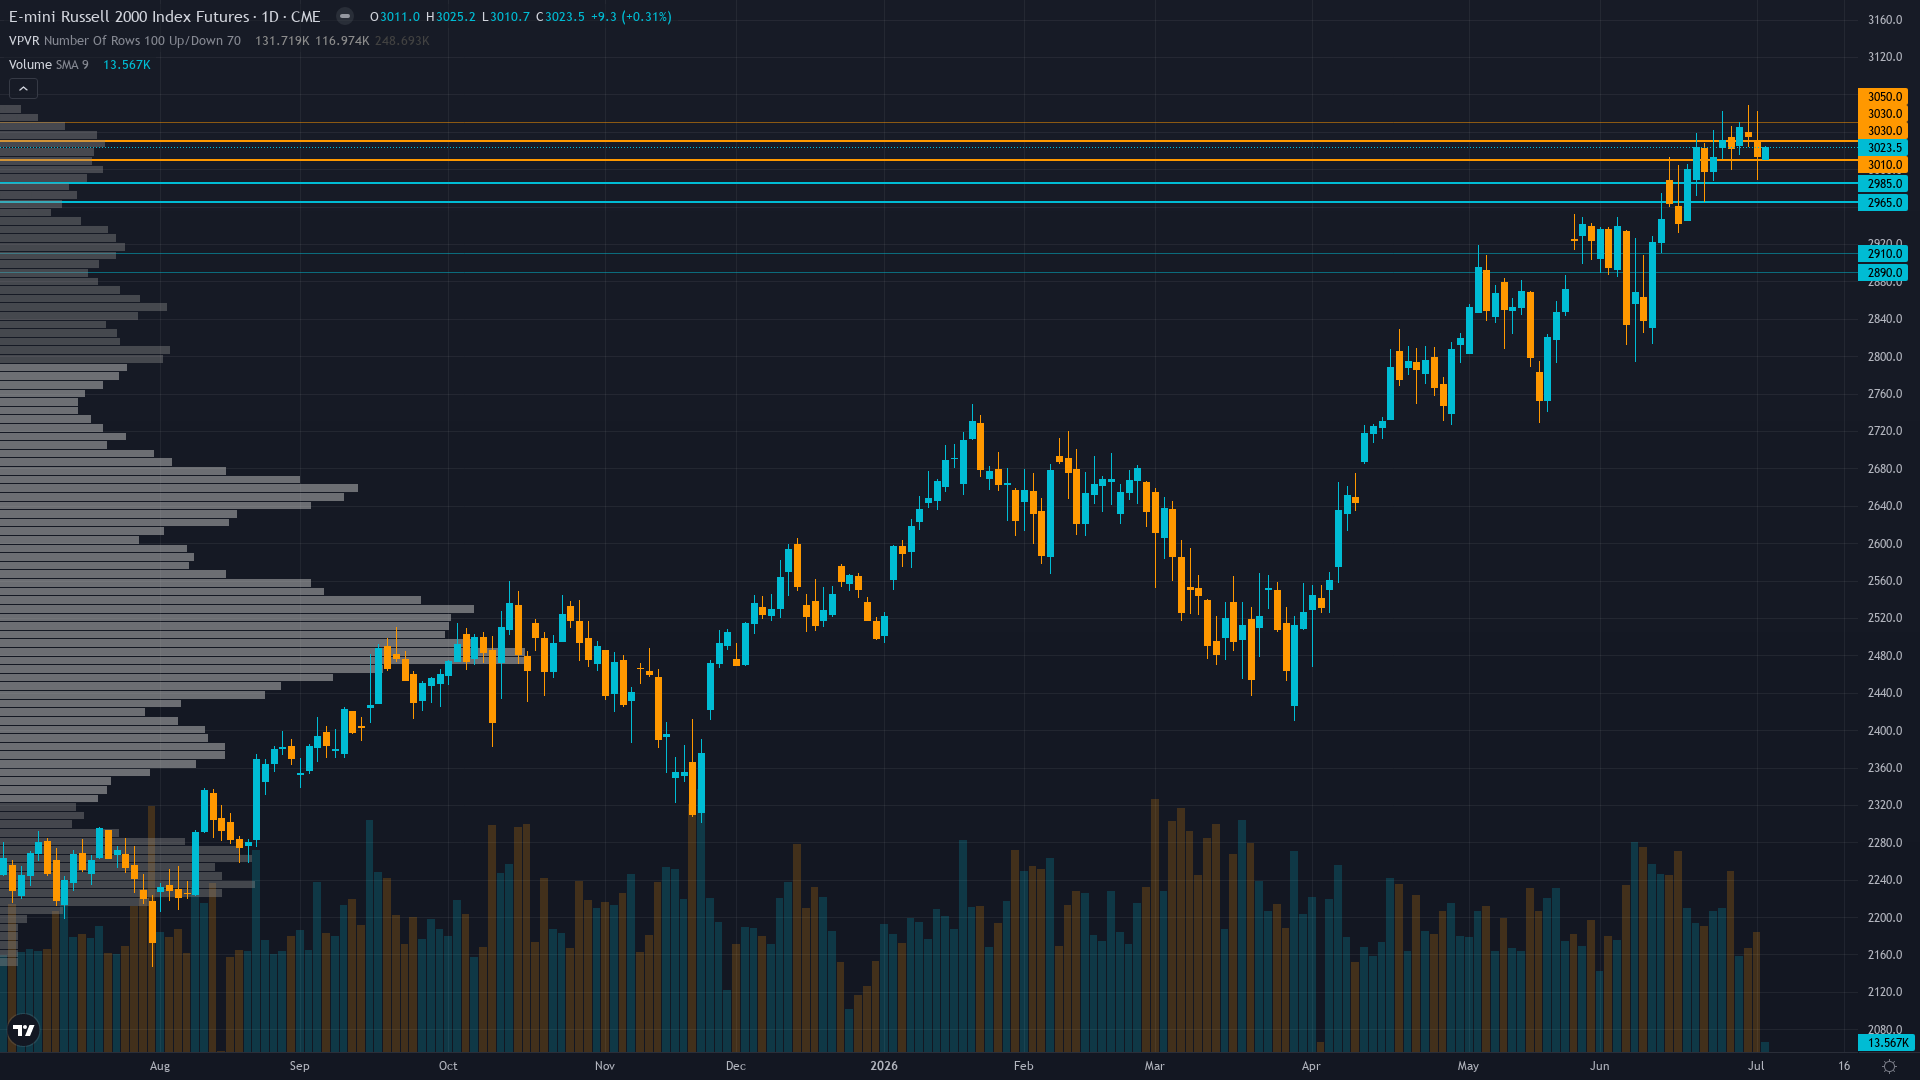
Russell 2000 is trading at 3023.5, up a modest 0.79% as the market edges higher.
June 26 reconstitution flows now fully exhausted after completing $11 trillion forced passive rebalancing, removing known mechanical bid that provided technical support through June 25 ATH, while persistent IWM outflows year-to-date show institutional caution despite price resilience near record highs with stale COT data limiting real-time smart money visibility
Market Consensus vs Our Analysis
Market consensus: Small-caps consolidating near June 25 all-time high at 3040.1 following successful reconstitution completion June 26, market positioned constructively on Q1 earnings validation and awaiting Q2 earnings season beginning mid-July to test elevated 44.9% growth expectations with Wall Street maintaining small-cap rotation narrative
Primary driver: Four consecutive CORRECT calls (June 12, June 19, June 26, July 3) totaling +5.43% cumulative gain since June 12 validates analytical framework accuracy, but current consolidation at 3023.5 just 0.5% below June 25 all-time high of 3040.1 lacks fresh catalyst after June 26 reconstitution completion exhausted mechanical buying pressure
Contrarian Assessment
Desk mildly bullish at conviction 5 on six-discipline agreement while acknowledging reconstitution exhaustion, Fed pivot uncertainty, and seasonal headwinds broadly aligns with market's mixed positioning (Fear & Greed 32 fear, AAII 42.3% bearish, put/call 0.53 complacent), creating low divergence as both desk and consensus recognize post-catalyst consolidation environment requiring patience for Q2 earnings or Fed clarity before conviction increases
Sentiment & Positioning
Sentiment around Russell 2000 futures is neutral, with no extreme positioning on either side. This balanced state often resolves when a catalyst breaks the equilibrium.
Options Market Signal
VIX at 15.81 near 52-week low of 13.38 signals extreme complacency with equity put/call at 0.53 showing only 0.53 puts per call traded, indicating minimal defensive hedging despite consolidation near all-time highs creating latent reversal risk but confirming bullish positioning without panic protection
Putting It Together
In summary, the positioning picture for Russell 2000 reflects fear conviction levels set against a consolidating market backdrop. Trend strength sits at 7/10, reflecting a market that has directional bias but hasn't reached extreme conviction. The interplay between smart money activity, retail sentiment, and options market signals will shape how this positioning resolves.
This analysis covers one dimension. Our full weekly report combines six specialist agents into a single actionable briefing with directional bias, key levels, and risk-opportunity matrix.
Start Free — Get the Market of the WeekFree weekly report · No credit card · Upgrade anytime



