Platinum Key Levels This Week — Support, Resistance & Confluence Zones
Platinum key levels breakdown: support zones, resistance zones, confluence and price structure.

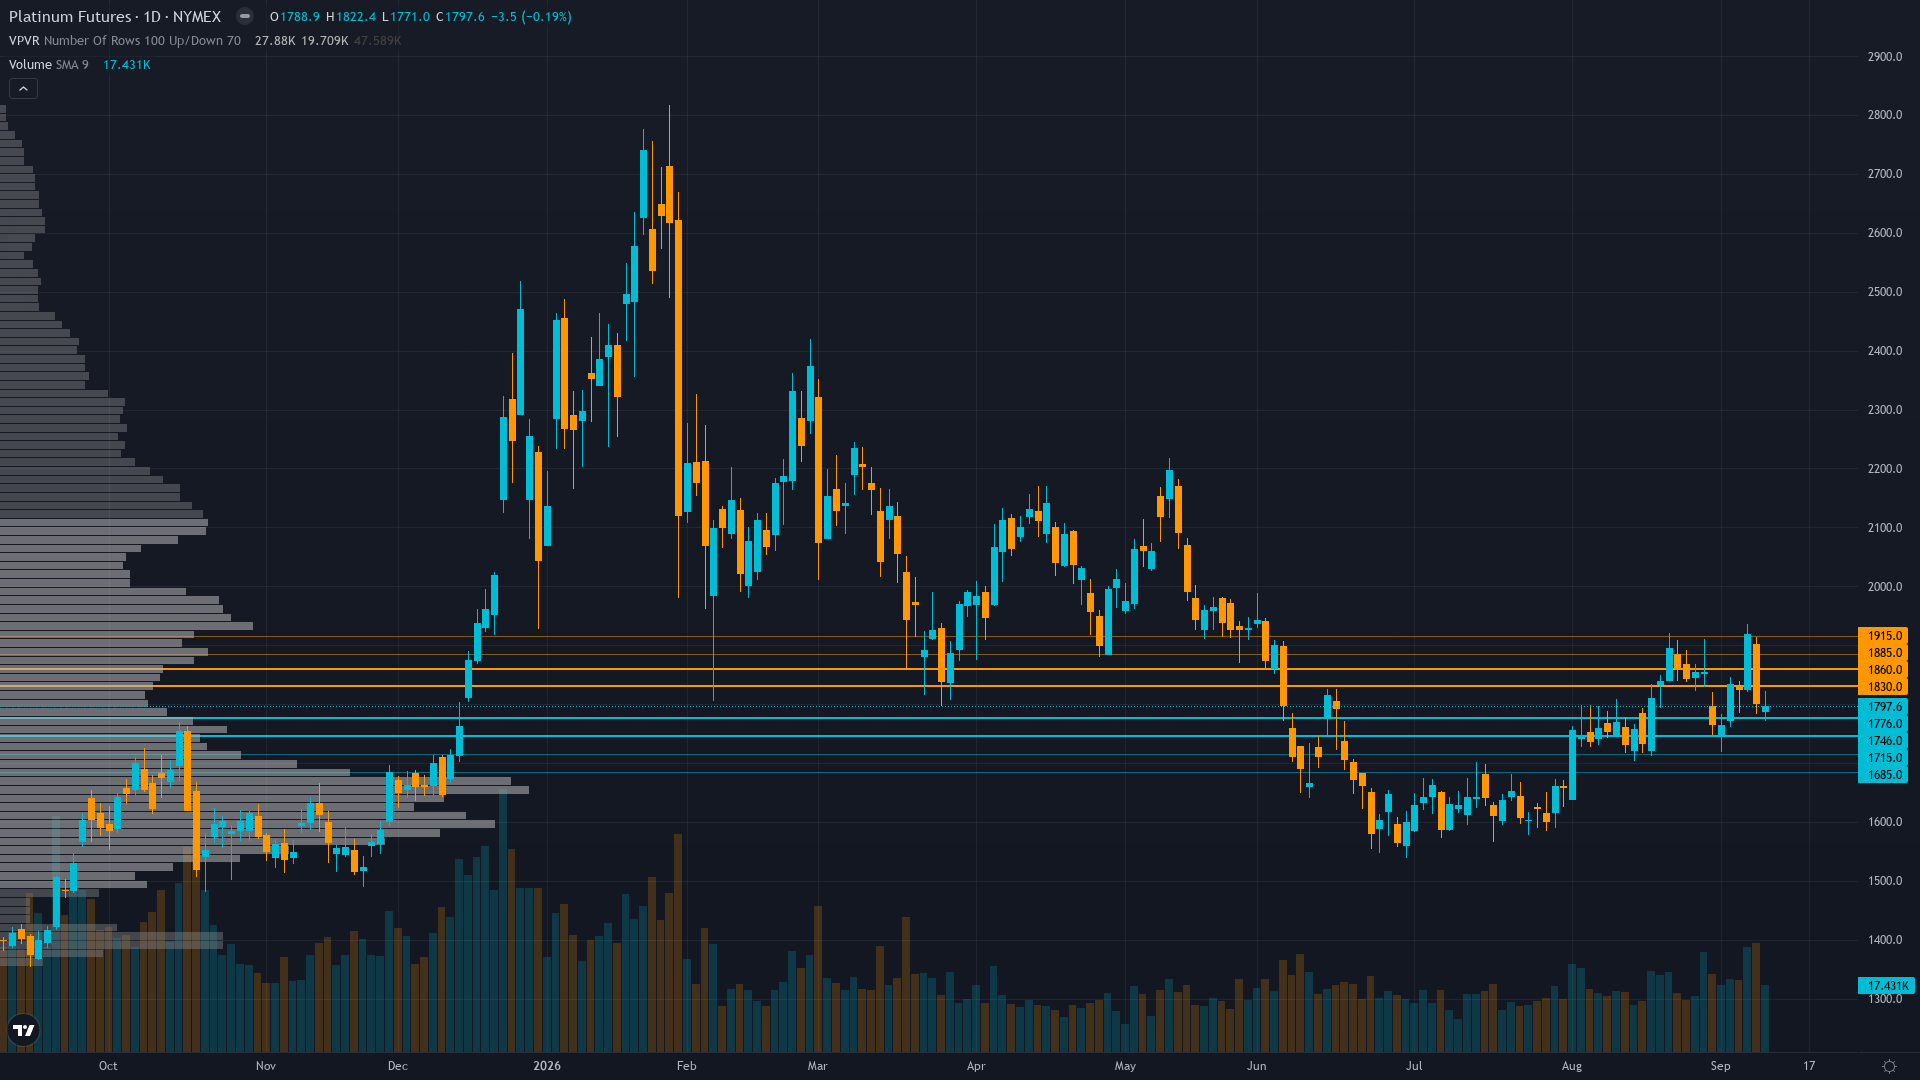
Current Price Structure
platinum sits at 1793.5 after slipping 0.03% — a shallow pullback rather than a decisive move. platinum futures is range-bound and tightening, with decreasing volatility signalling a directional resolution ahead.
Mixed daily trend structure with price at $1,793.50 positioned above key moving averages but showing three consecutive weekly declines totaling -5.3% from the August 21 high of $1,893.80, RSI neutral around 40-50 with no divergence, consolidation between $1,761 (Sep 3 low) and $1,800 (psychological resistance), with primary technical risk being breakdown below $1,707 (50-day EMA) toward $1,650 major support
With trend strength at only 3/10, any directional bias is thin and easily disrupted.
Support Zone Context
Below the current level, NYMEX platinum has structural support where demand has historically stepped in. The reliability of these zones depends on the volume profile and the number of prior interactions.
In the current consolidating environment, support zones carry standard probability of reaction.
Ceilings & Supply Zones
Above current price, platinum futures faces resistance zones where selling pressure has historically intensified. These levels represent previous supply zones, profit-taking areas, or structural barriers that price needs to overcome for continuation.
How firmly these zones hold depends on the confluence of volume, prior reactions, and the current market regime.
Where Disciplines Converge
For NYMEX platinum, the levels that matter most are those confirmed by independent analytical approaches. When six different disciplines identify the same zone, the signal-to-noise ratio improves dramatically.
Normal but compressed vol regime suggests daily ranges of $35-55 versus the $50-70 seen during the August breakout and $80-120 during Q2 breakdown; the consolidation above $1,761 has narrowed the likely range to $35-50/day; stops placed tighter than $30 risk noise-triggering given PL's 7.24% average weekly move class characteristic
How Macro Agent Desk Identifies Key Levels
Macro Agent Desk identifies key levels through a six-agent process. Each analytical discipline contributes independently — technical for structure, institutional for smart money interest, options for hedging activity, fundamentals for fair value context, sentiment for crowd positioning, and economics for catalyst timing.
What this means in practice: every key level in the full weekly report has been stress-tested across multiple independent analytical frameworks before it reaches the page.
Our paid reports include specific support and resistance levels identified by six specialist agents — technical structure, institutional positioning, options flow, fundamentals, sentiment, and economic analysis. Not just lines on a chart, but zones validated by multi-discipline confluence.
Start Free — Get the Market of the WeekFree weekly report · No credit card · Upgrade anytime



