Platinum Forecast This Week — Outlook, Drivers & Key Levels
This week's Platinum outlook: key drivers, volatility context, risk-opportunity assessment and the week ahead.

Market Overview
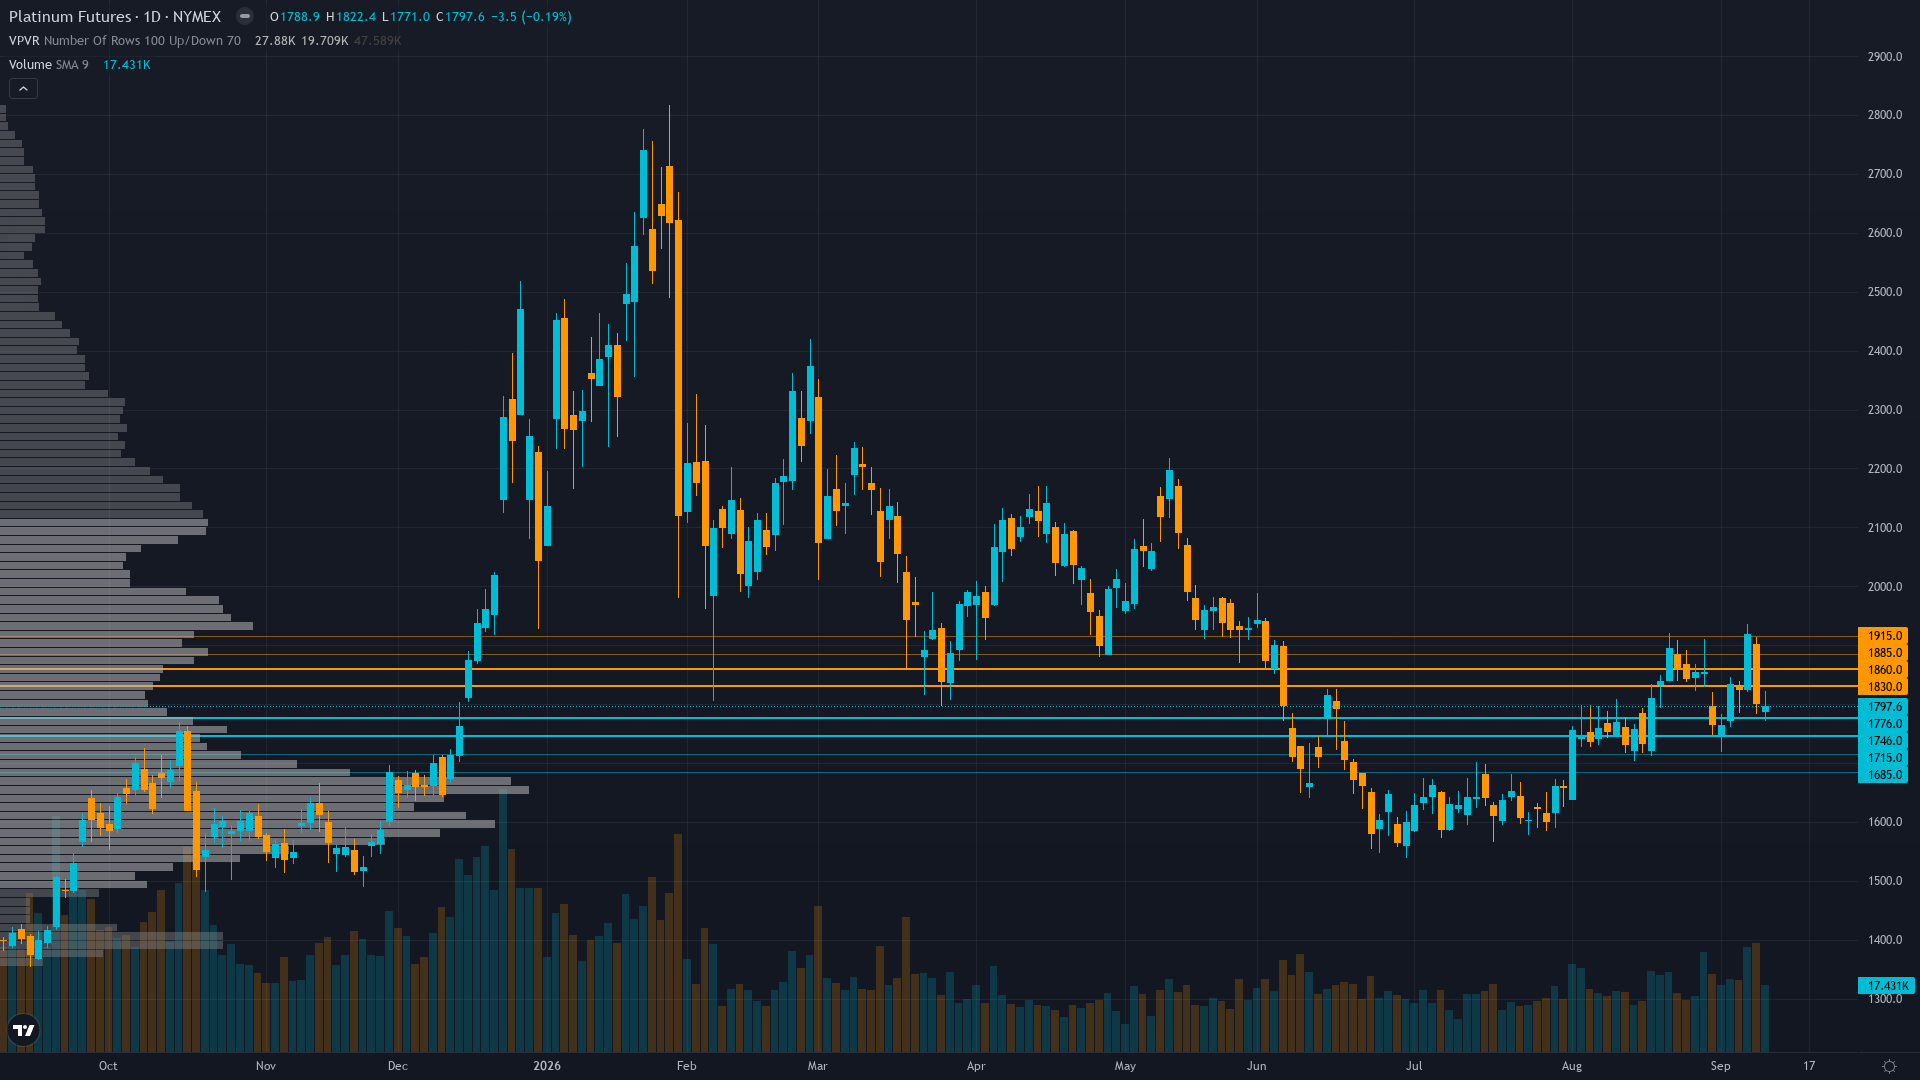
At 1793.5, platinum has eased 0.03% in a controlled retreat. platinum futures is range-bound and tightening, with decreasing volatility signalling a directional resolution ahead.
Market digesting three consecutive weeks of pullback from August highs with the WPIC deficit thesis intact but price action degrading bullish momentum, looming FOMC binary catalyst with 80% probability of a hawkish 25bps hike creating macro headwind that is capping any recovery attempts despite persistent institutional dip-buying at $1,761 support
This Week's Catalysts & Drivers
Primary driver: Three consecutive weeks of contrary price action (-2.89%, -0.95%, -1.04%) have degraded the BULLISH thesis health score below actionable threshold, with price declining from $1,893.80 to $1,793.50 (-5.3%) despite the WPIC structural deficit thesis remaining intact and a +3.93% intra-week rally on Sep 3 demonstrating persistent dip-buying from institutional players
Secondary factor: FOMC binary catalyst on September 16-17 (3 days forward) with Polymarket prediction markets pricing 80% probability of a 25bps rate HIKE to 3.88%, creating hawkish risk that would strengthen USD and pressure precious metals through elevated real yields, overriding the transitional macro regime's neutral stance
Additional influence: Prediction market data shows massive $140.5M in volume on the September FOMC outcome, with the market heavily skewed toward a hike — a hawkish outcome that is not yet fully reflected in platinum's current price and could trigger additional liquidation if realized, especially given the thesis degradation from three consecutive down weeks
Economic backdrop: TRANSITIONAL macro regime: VIX at 15.84 signals neutral risk appetite, Fed funds at 3.63% with inflation at 2.36% moderating, 10Y yield at 4.96% up 18bp in one week repricing hawkish expectations, 2s10s curve at 33bp flattening reflecting growth concerns, FOMC Economic Projections on Sep 16 (3 days forward) with prediction markets pricing 80% probability of a 25bps hike — a hawkish catalyst that would represent a material tightening from current expectations
Fundamental assessment: WPIC structural deficit thesis remains intact: fourth consecutive annual shortage of 297 koz, above-ground stocks at critically low 1,747 koz (under 3 months of global demand), South Africa's power crisis deepening with Eskom's cost crisis choking mine production, hydrogen fuel cell demand growing to 300,000 oz annually — but price action has rejected the bullish narrative for three consecutive weeks, creating a fundamental-versus-price paradox similar to the May-August disconnect that preceded the -44% correction from $2,852 ATH
Technical Picture
Mixed daily trend structure with price at $1,793.50 positioned above key moving averages but showing three consecutive weekly declines totaling -5.3% from the August 21 high of $1,893.80, RSI neutral around 40-50 with no divergence, consolidation between $1,761 (Sep 3 low) and $1,800 (psychological resistance), with primary technical risk being breakdown below $1,707 (50-day EMA) toward $1,650 major support
At 3/10, trend strength is subdued, suggesting the market lacks a clear directional mandate.
Bull & Bear Case
Primary risk: Thesis degradation continues: three consecutive MISSED weeks (-2.89%, -0.95%, -1.04%) with net -5.3% decline from August highs have brought the thesis health score to 3 (below the 5 minimum for directional calls), and a hawkish FOMC surprise on Sep 16 with 80% market-implied probability of a 25bps hike could accelerate selling toward $1,707 (50-day EMA) and $1,650 major support (-10.2% from current), as the institutional accumulation pattern that supported the BULLISH thesis fails to hold support levels (Probability: medium)
Primary opportunity: The WPIC structural deficit thesis (297 koz fourth consecutive annual shortage, critically low above-ground stocks at 1,747 koz under 3-month coverage, South African supply crisis intensifying, hydrogen economy demand growth not fully priced) remains the most compelling fundamental narrative in precious metals, and the current three-week pullback has brought non-commercial positioning to only the 51.9th percentile — mid-range and not crowded — with significant dip-buying demonstrated on Sep 3 (+3.93% intra-week rally from $1,761), suggesting the deficit thesis retains institutional conviction that could reassert if the Sep 16 FOMC delivers a dovish surprise (21% probability per Polymarket) (Timeframe: 1-3 weeks contingent on Sep 16 FOMC outcome: a dovish surprise (no hike or no change) would remove the primary macro headwind and allow the structural deficit thesis to reassert as the dominant narrative; a hawkish hike would likely extend the pullback toward $1,707 before the thesis reasserts at lower levels with better risk/reward)
This week's edge: Below noise threshold — thesis health degraded. The WPIC structural deficit thesis (297 koz 4th consecutive deficit, SA power crisis, critically low above-ground stocks) remains analytically intact and retains institutional buying conviction demonstrated by the Sep 3 +3.93% rally from $1,761, but three consecutive weeks of contrary price action (-5.3% net from August highs) and binary FOMC risk with 80% hike probability create a low-information-edge environment that precludes maintaining a directional bias this week
Volatility Regime
Volatility for platinum price is at the 42th percentile over 90 days — a normal regime that allows for standard position sizing and conventional trade management. The vol trend is flat, with no meaningful shift across timeframes. Stable vol environments often lull traders before a regime change arrives.
Normal but compressed vol regime suggests daily ranges of $35-55 versus the $50-70 seen during the August breakout and $80-120 during Q2 breakdown; the consolidation above $1,761 has narrowed the likely range to $35-50/day; stops placed tighter than $30 risk noise-triggering given PL's 7.24% average weekly move class characteristic
What to Watch
The FOMC Economic Projections and rate decision (Sep 16, 18:00 UTC) — Polymarket pricing 80% probability of a 25bps rate HIKE to 3.88%, with dot plot and summary of economic projections released simultaneously; a hawkish outcome would strengthen USD and elevate real yields, directly pressuring non-yielding precious metals like platinum on Wednesday 16 September stands as the week's primary risk event — high-impact and capable of overriding the existing technical and sentiment setup.
The interplay between consolidating market conditions and upcoming catalysts will define this week's trading landscape for NYMEX platinum.
This analysis covers one dimension. Our full weekly report combines six specialist agents into a single actionable briefing with directional bias, key levels, and risk-opportunity matrix.
Start Free — Get the Market of the WeekFree weekly report · No credit card · Upgrade anytime



