Platinum Forecast This Week — Outlook, Drivers & Key Levels
This week's Platinum outlook: key drivers, volatility context, risk-opportunity assessment and the week ahead.

Current Market Picture
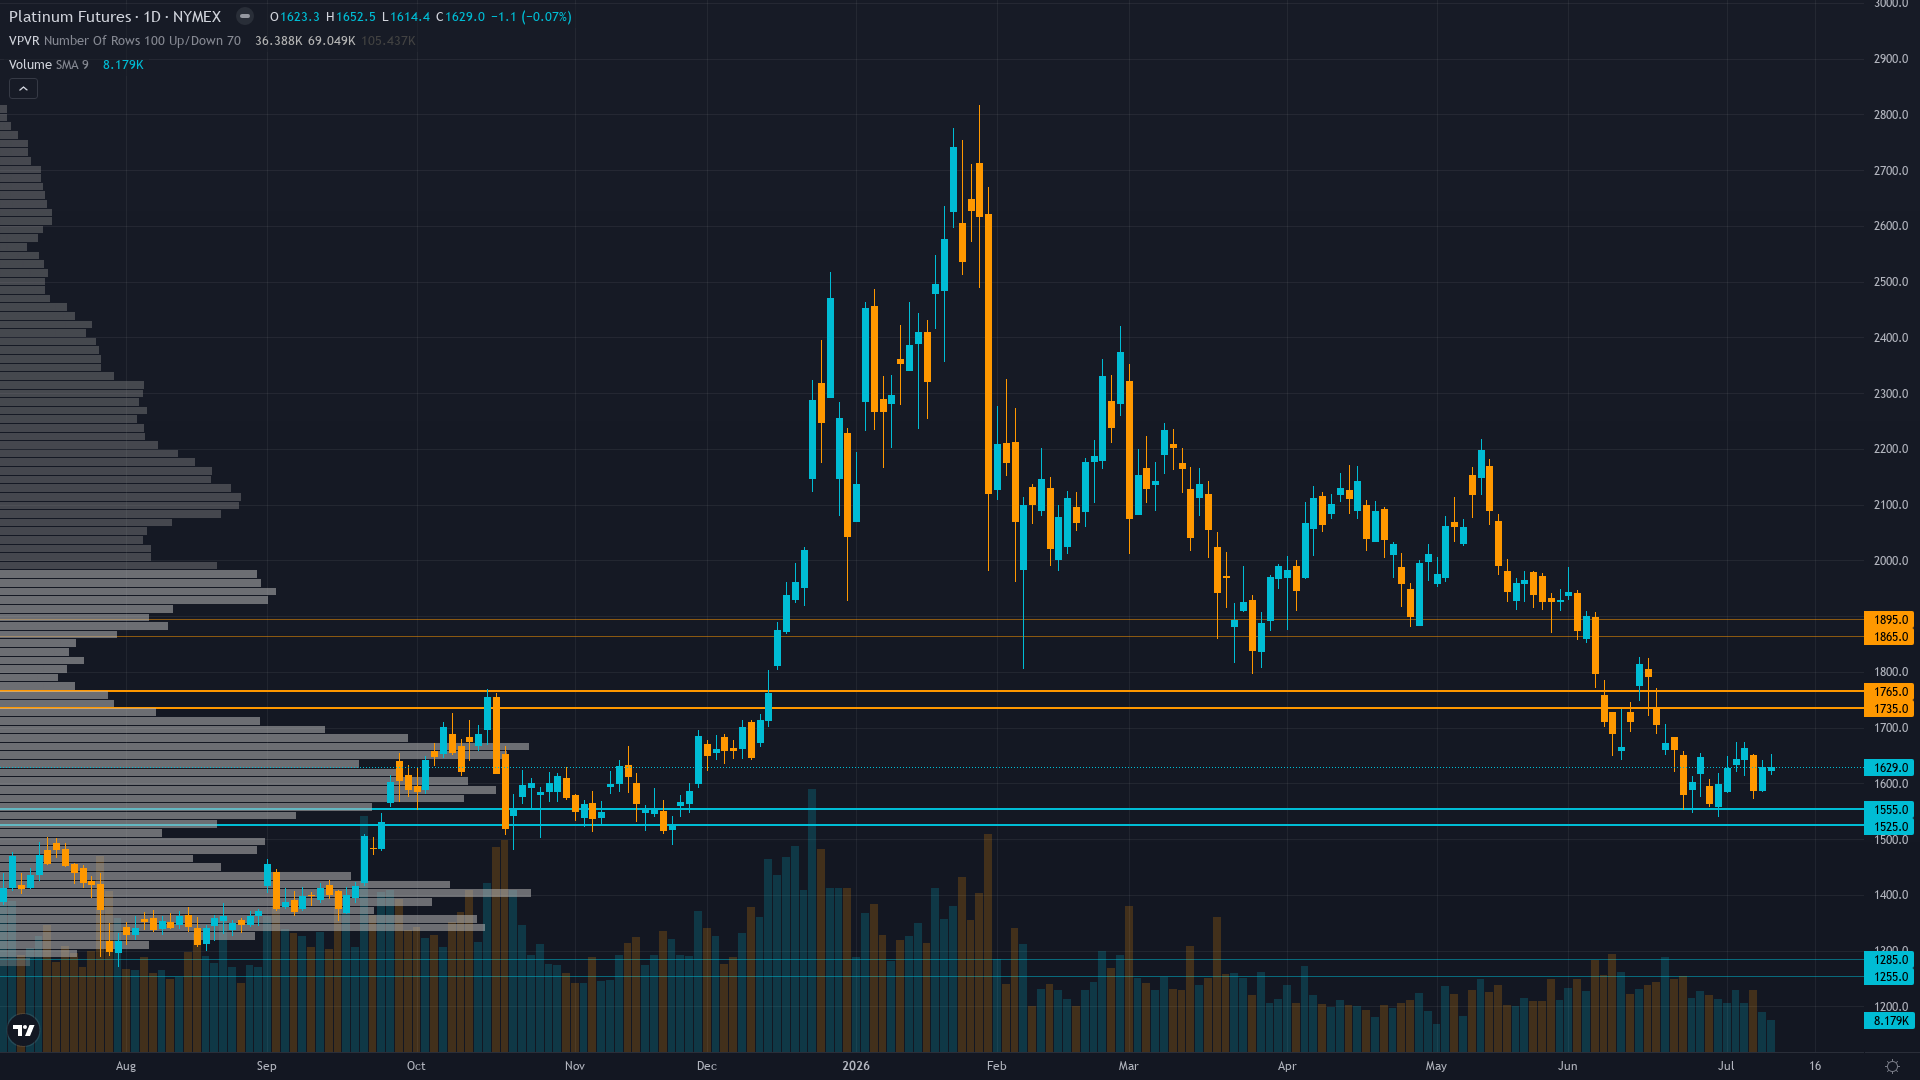
Trading at 1629 with a 0.07% dip, platinum is giving back ground gradually. platinum futures is in a breaking down market state, requiring careful assessment of current conditions.
Market violently rejecting WPIC May 18 Q1 2026 report bullish full-year deficit upgrade with -21% decline since announcement, prioritizing Q1 surplus evidence (268 koz first in six quarters from 18% YoY supply growth) over full-year deficit forecast suggesting either forecasting credibility concerns or supply response invalidating scarcity thesis amid hawkish Fed repricing with June 16-17 removal of rate cut expectations and elevated real yield headwinds above 2.17%
Risk & Opportunity
Primary risk: Continued breakdown below $1,540 immediate support triggers technical cascade toward $1,270 major support creating additional 12-22% downside risk despite WPIC structural deficit story as July 29-30 FOMC delivers hawkish surprise reinforcing elevated real yields above 2.20%, managed money liquidation accelerates from current mid-range positioning creating forced selling cascade, and market continues prioritizing fundamental regime shift from extreme deficit to near-balance over residual scarcity thesis (Probability: high)
Primary opportunity: Reversal from $1,270-1,540 support zone if July 29-30 FOMC delivers significantly dovish surprise contrary to June 16-17 hawkish pivot triggering USD reversal and real yield compression below 1.80%, combined with VIX spike above 20 creating safe-haven flows and sustained technical stabilization allowing residual WPIC deficit thesis (though materially weakened from prior 689 koz average forecasts to current 331 koz 2026-2030 outlook) to reassert over Q1 surplus evidence enabling recovery toward $1,880 resistance over 8-12 weeks (Timeframe: 8-12 weeks contingent on July 29-30 FOMC dovish surprise reversing June 16-17 hawkish pivot, sustained hold above $1,270 major support establishing capitulation base, and market digestion period allowing fundamental thesis recalibration to near-balance reality rather than extreme deficit narrative creating more realistic valuation framework)
This week's edge: Maintaining tactical bearish lean at moderate conviction acknowledges technical breakdown momentum and fundamental regime shift from extreme deficit to near-balance as WPIC narrative materially weakens; market correctly pricing supply response reality while desk sees residual structural deficit thesis (331 koz average 2026-2030) as potential 8-12 week reversal catalyst only if July 29-30 FOMC delivers dovish surprise reversing June hawkish pivot, though stale information environment this week reduces conviction from higher levels
What's Driving Price
Primary driver: Technical breakdown accelerating with price testing critical $1,540 support following -42% decline from January $2,915 peak as market continues rejecting WPIC structural deficit thesis amid persistent macro headwinds from elevated 2.17% real yields and ongoing ETF liquidation cascade despite three consecutive CORRECT desk calls restoring operational credibility
Secondary factor: Fundamental regime shift confirmed as WPIC May 18 Q1 2026 report revealed first surplus in six quarters (268 koz from 18% YoY supply growth) contradicting upgraded full-year 297 koz deficit forecast, creating market skepticism about forecasting credibility and suggesting supply response may be invalidating multi-year scarcity thesis as price rejects bullish narrative with -21% post-report decline
Additional influence: Fed Chair Warsh's June 16-17 FOMC hawkish pivot removing rate cut expectations and raising dot plot to 3.8% driving 10Y TIPS real yields to 2.17% (June 26 data) creating structural headwind for non-yielding precious metals while VIX normalized to 15.03 reduces safe-haven premium despite gold at record highs confirming platinum's dual industrial exposure creates vulnerability pure monetary metals avoid
Economic backdrop: Fed Chair Warsh's June 16-17 FOMC held rates at 3.50-3.75% but removed expected rate cut from forward guidance and raised 2026 dot plot to approximately 3.8% with 9 of 19 officials now seeing at least one rate hike this year representing material hawkish shift; real yields at 2.17% (10Y TIPS June 26) and USD strength create persistent headwind for non-yielding precious metals while VIX normalization to 15.03 reduces safe-haven premium
Fundamental assessment: WPIC May 18 Q1 2026 report creates unresolved paradox: Q1 surplus of 268 koz (first in six quarters driven by 18% YoY supply growth) contradicts upgraded full-year 2026 deficit forecast of 297 koz from prior 240 koz, with market's violent -21% rejection since announcement suggesting either forecasting credibility concerns or prioritization of observable Q1 supply response evidence over forward deficit projections despite critically low 2.613M oz above-ground stocks (4-month supply coverage)
Chart Assessment
Catastrophic breakdown structure confirmed with price declining from $2,068 May 17 to current $1,629 (-21% post-WPIC report decline) testing critical $1,540 support following decisive violation of $2,000 and $1,750 psychological levels; declining open interest suggests liquidation cascade rather than consolidation with RSI showing bearish momentum and no reversal pattern formation visible
With trend strength at only 3/10, any directional bias is thin and easily disrupted.
Volatility Context
At the 82th percentile of its 90-day range, platinum price volatility is running hot, creating both opportunity and risk for directional traders. Realised vol is holding its current level, suggesting the market has found a temporary equilibrium in its risk pricing.
High but stable volatility suggests daily ranges of $60-100 expected versus prior $150-200 during peak January-March extremes; breakdown below $1,540 would likely expand ranges to $100-150 on cascading stop-triggered selling while sustained hold above $1,270 and VIX normalization below 15 could compress ranges to $40-80 signaling stabilization phase beginning post-July FOMC
Week Ahead Outlook
The next major catalyst is FOMC meeting July 29-30 with potential for continued hawkish language reinforcing higher-for-longer stance after June 16-17 removal of rate cut expectations from forward guidance creating additional binary event risk; any hawkish surprise would intensify real yield pressure on platinum while dovish pivot could trigger short-covering rally from oversold technical conditions on Thursday 30 July — a high-impact event that could materially shift the directional picture.
For PL futures, the balance between existing momentum and scheduled risk events sets the stage for the week ahead.
This analysis covers one dimension. Our full weekly report combines six specialist agents into a single actionable briefing with directional bias, key levels, and risk-opportunity matrix.
Start Free — Get the Market of the WeekFree weekly report · No credit card · Upgrade anytime



