Platinum COT & Institutional Positioning — Smart Money Analysis
Platinum institutional positioning: COT data, sentiment analysis and smart money flow assessment.

Institutional Positioning
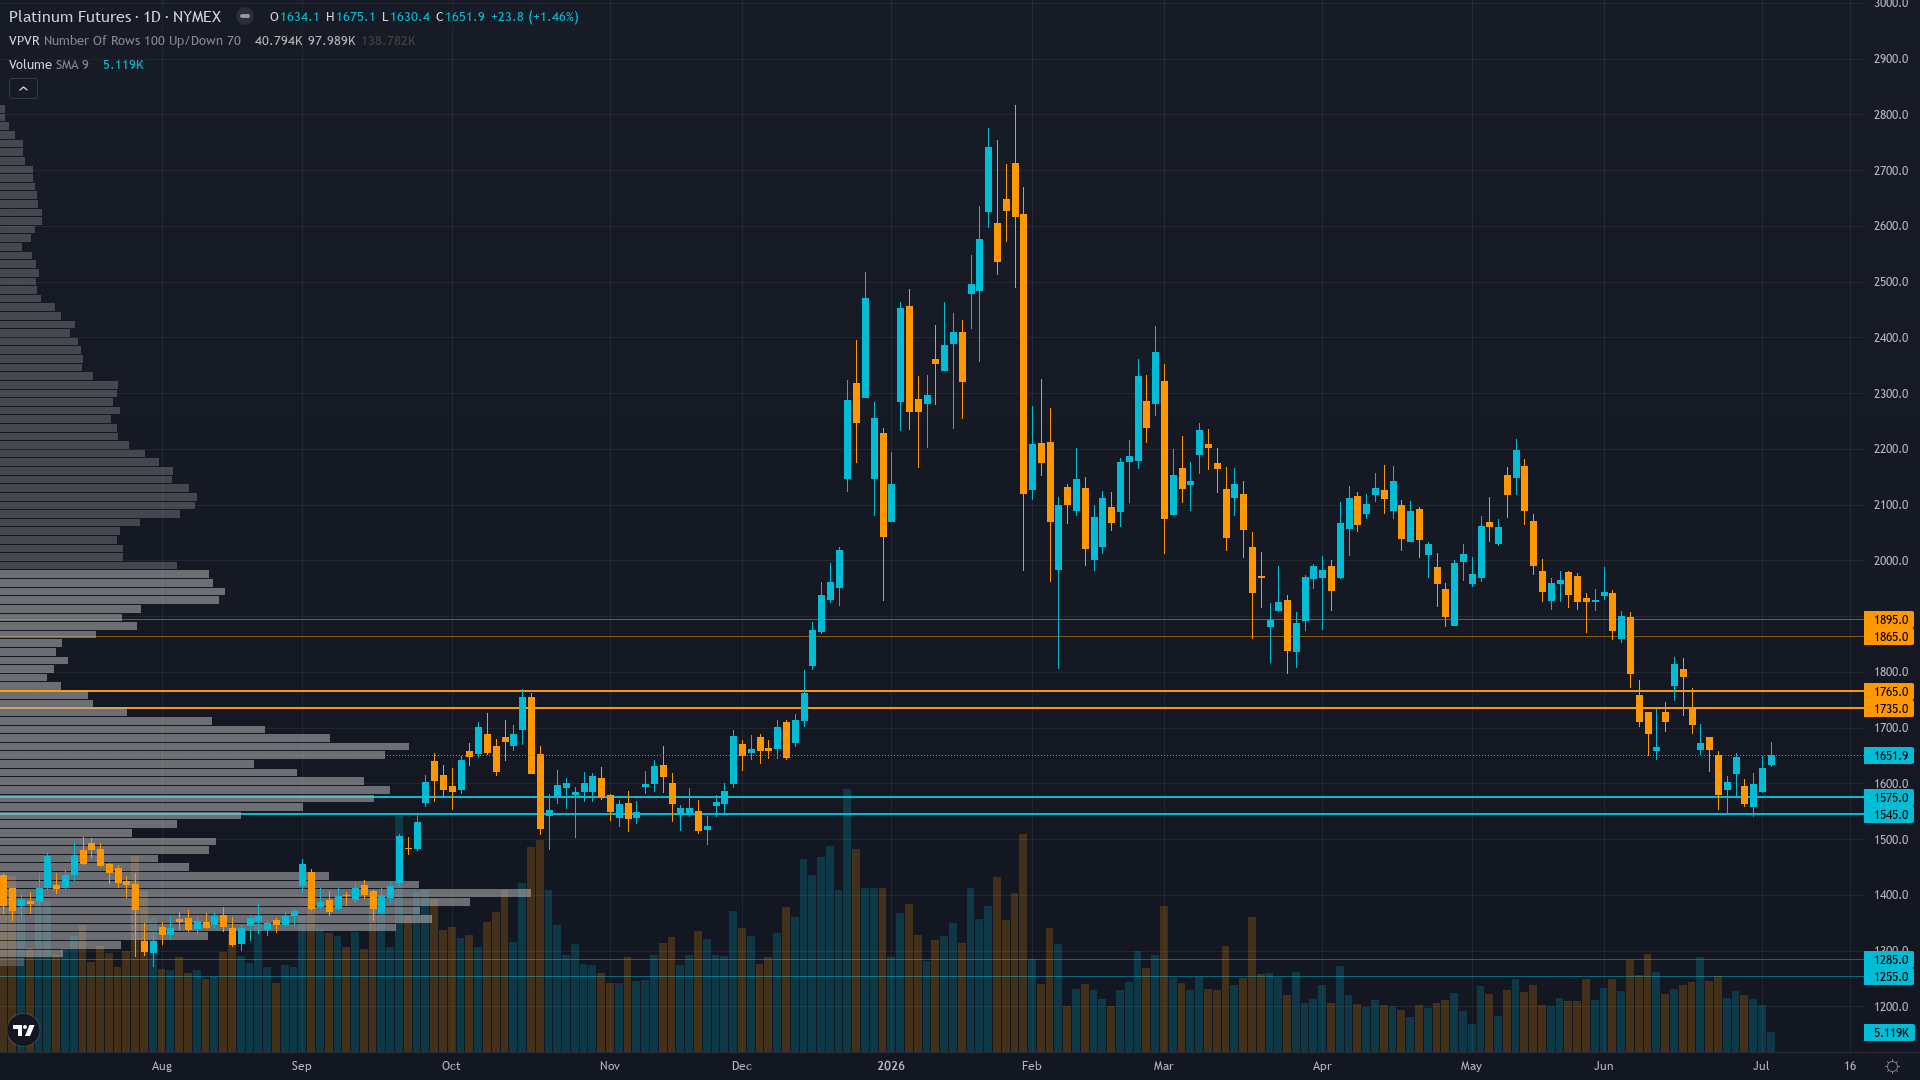
Trading at 1653.5 after a 1.56% move higher, platinum continues to attract buying interest.
Managed money net long approximately 7,500 contracts (June 23 COT data, 12 days stale) at mid-range 40th-60th percentile positioning suggests neither crowded long vulnerability nor capitulation opportunity, reflecting trend-following accumulation that has not yet capitulated despite -42% decline from January peak creating potential for further liquidation if $1,540 immediate support fails
Where We Agree & Diverge
Market consensus: Market violently rejecting WPIC May 18 Q1 2026 report bullish full-year deficit upgrade with -25% decline since announcement, prioritizing Q1 surplus evidence (268 koz first in six quarters) and fundamental regime shift from multi-year 1M oz deficits to 2026 near-balance (20k oz surplus) over residual structural deficit thesis as elevated real yields above 2.00% and ETF liquidation cascade (225k oz Q1 withdrawals) create persistent bearish momentum
Primary driver: Technical breakdown accelerating with price declining from $1,630 last week to current $1,560-1,653 zone testing critical support following -42% collapse from January $2,915 peak as market continues rejecting WPIC structural deficit thesis amid persistent macro headwinds from elevated real yields and ETF liquidation cascade
Consensus Gaps
Desk's bearish tactical lean at -1.5 broadly aligns with current market momentum and technical breakdown structure, though desk assigns lower conviction (5) than market's aggressive -25% rejection of WPIC May 18 deficit upgrade might suggest; low divergence reflects disciplined acknowledgment that market is correctly pricing fundamental regime shift from extreme deficit to near-balance reality rather than expressing contrarian view, as desk sees breakdown momentum and ETF liquidation cascade as dominant near-term forces overwhelming residual structural deficit thesis
Sentiment Analysis
Positioning in platinum futures is balanced, with neither bulls nor bears holding a decisive edge. Neutral sentiment typically precedes a directional catalyst.
Derivatives Intelligence
No current options data available for July 2026 platinum contract as Barchart shows no accessible options chain; thin platinum options liquidity environment provides no meaningful directional conviction this cycle with Options discipline unable to contribute to synthesis
Net Assessment
The institutional landscape for platinum price shows neutral sentiment. Trend strength is low at 3/10, indicating weak directional conviction and potential for range-bound behaviour. The combination of positioning data, sentiment, and options flow provides context for understanding where smart money is leaning heading into the week.
This analysis covers one dimension. Our full weekly report combines six specialist agents into a single actionable briefing with directional bias, key levels, and risk-opportunity matrix.
Start Free — Get the Market of the WeekFree weekly report · No credit card · Upgrade anytime



