Nasdaq 100 Forecast This Week — Outlook, Drivers & Key Levels
This week's Nasdaq 100 outlook: key drivers, volatility context, risk-opportunity assessment and the week ahead.

This Week's Starting Point
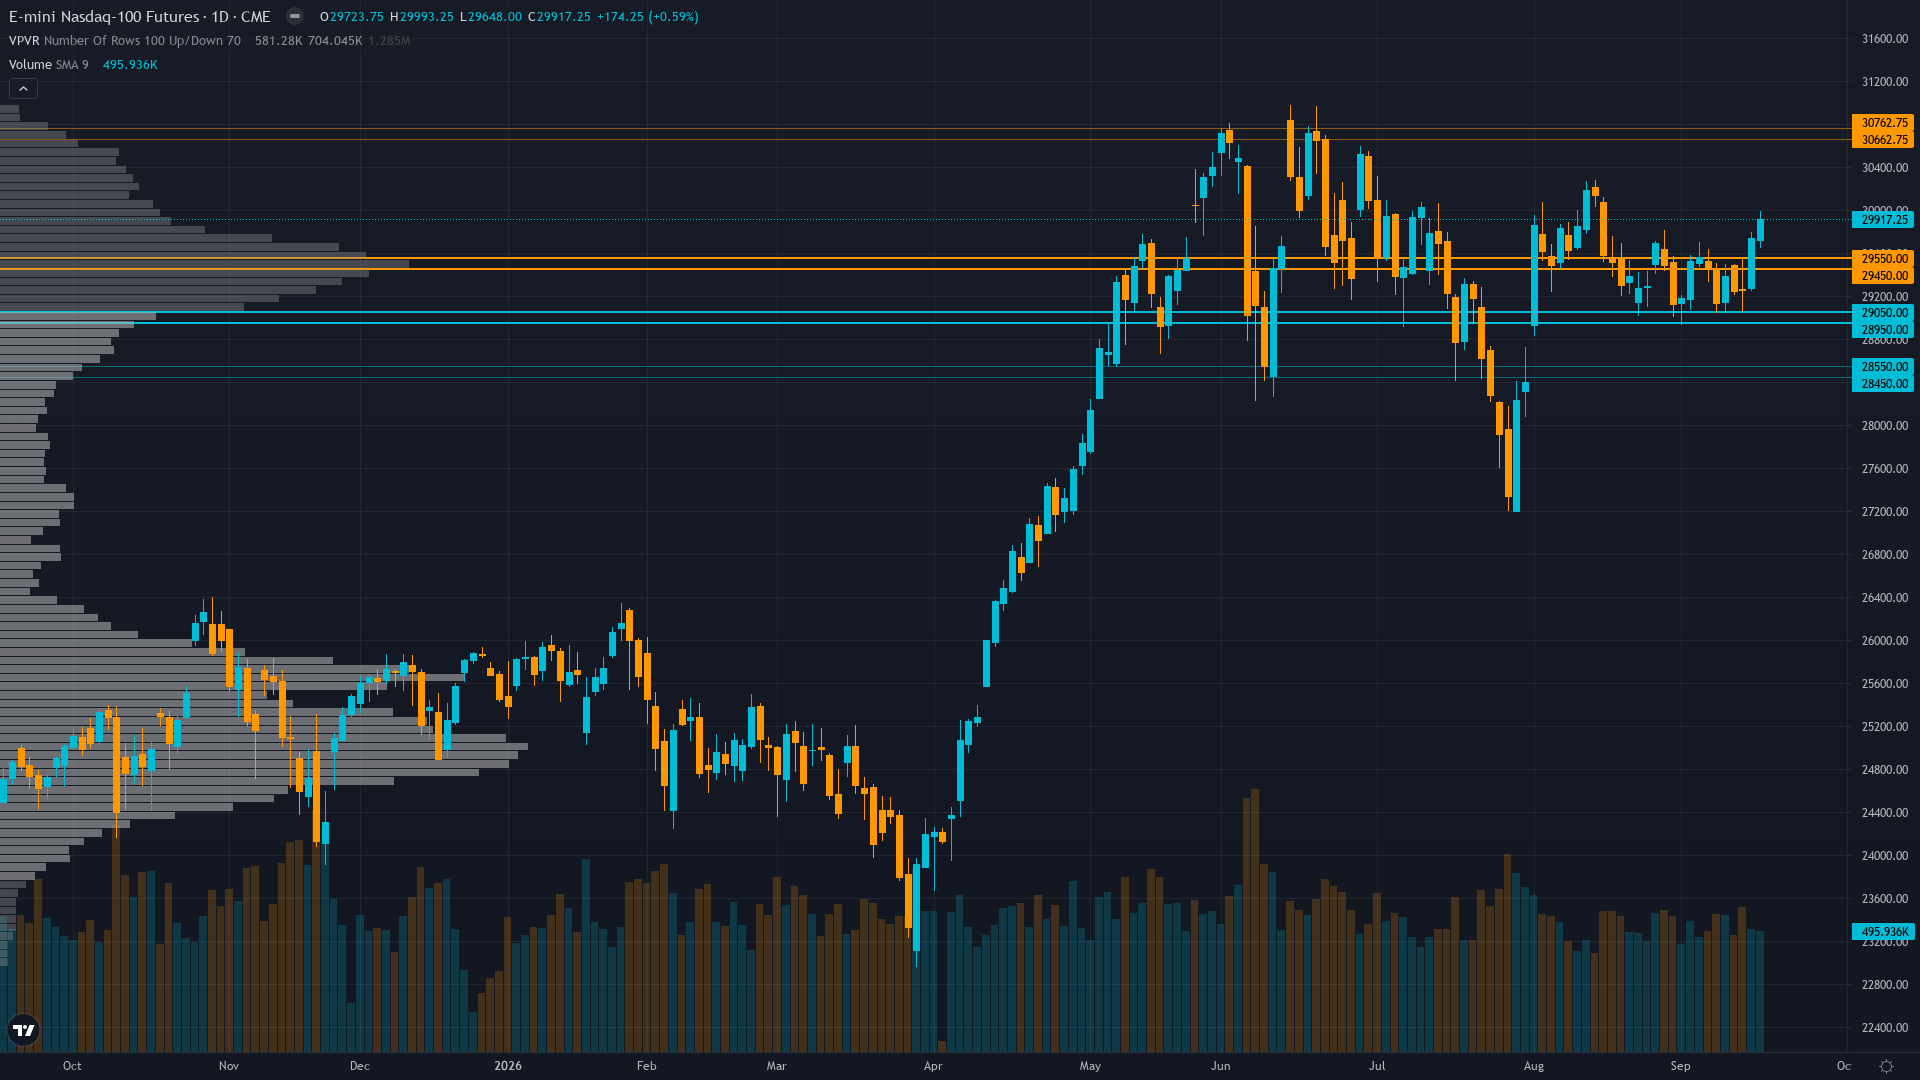
Trading at 29613.68 with a 0.17% dip, Nasdaq 100 is giving back ground gradually. Price action in Nasdaq 100 futures has compressed into a consolidation pattern, typically a precursor to a directional breakout.
Cautiously constructive with consensus acknowledging the stark retail-institutional divergence and stable macro backdrop while remaining tactical given 10Y yield above 5%, September seasonal headwinds, and the approaching Sep 23 PMI data as the next directional catalyst; most participants are positioned for range-bound continuation rather than directional breakout
Forces in Play
Primary driver: Institutional positioning surge with CFTC COT data from Sep 15 showing non-commercial net longs increased +12,823 contracts (+61% weekly) to +33,718 at the 83.5th percentile of the 3-year range, representing accelerating trend-following accumulation that confirms institutional conviction in the AI-driven earnings cycle as Q3 2026 earnings season approaches in October
Secondary factor: Extreme retail bearish sentiment with AAII survey showing 28.8% bulls vs 53.3% bears (week ending Sep 16, 2026), creating a -24.5% bull-bear spread approaching historical capitulation levels, while VIX at 14.81 remains in neutral territory indicating no panic — a classic contrarian bullish configuration where the crowd has thrown in the towel but actual risk appetite remains intact
Additional influence: AI capex structural support confirmed at roughly $800B in 2026 across four major Nasdaq-listed hyperscalers (Amazon, Google, Meta, Microsoft) per Nasdaq Sep 1, 2026 analysis, providing fundamental underpinning for NQ earnings growth trajectory that offsets the headwind from the 10-year Treasury yield at 5.01% testing multi-year highs
Economic backdrop: RISK-ON macro regime with VIX at 14.81 well below 20 threshold, HY credit spreads stable at ~270bps, inflation contained at 2.33%, unemployment at 4.1%, Fed funds at 3.63% with dot plot projecting decline toward 3.25% long-run; S&P Global PMIs due Sep 23 with estimates showing continued expansion (Composite 55.2, Manufacturing 53.6, Services 56); Chicago Fed Activity Index due Sep 21 with estimate 0.2 vs prior -0.08
Fundamental assessment: Nasdaq-100 forward P/E at 25.17 represents modest 13% discount to historical average of 29, with Q2 2026 blended earnings growth of 75.1% significantly surpassing 28.9% forecasts; AI-driven revenue momentum intact with hyperscaler capex projected at ~$800B for 2026, though CapEx peak scenario where infrastructure spending decelerates before revenue conversion catches up remains the primary structural risk
Technical Landscape
Consolidating at 29,614 within a 29,000-30,000 range, price sits just below the 200-day MA (~29,700) but above the 50-day MA (~29,367) per Investing.com data; RSI at 45.43 neutral, MACD positive at +30.4 generating buy signal; 8 of 12 moving averages show buy signals; the index is at 85.5% of 52-week range reflecting elevated but not extreme positioning; the 29,000-29,500 zone has held as reliable support through the September selloff
Trend strength sits at 5/10, reflecting moderate directional pressure without clear dominance.
Risk-Reward Assessment
Primary risk: Breakdown below 29,500 immediate support triggers re-test of 29,000 major support as 10-year Treasury yield at 5.01% continues to pressure growth stock multiples, amplified by the September seasonal headwind (Nasdaq-100 averages -0.6% to -2.1% in September per historical data), while the elevated COT net long positioning at 83.5th percentile creates crowded-trade vulnerability to any negative catalyst (Probability: medium)
Primary opportunity: Convergence of extreme retail bearish sentiment (AAII -24.5% spread approaching capitulation), accelerating institutional accumulation (+61% weekly COT increase to 83.5th percentile), and approaching quarter-end window dressing on Sep 30 provides asymmetric upside potential; a break above 29,970-30,000 resistance could trigger short covering into quarter-end, targeting a retest of the 30,713 52-week high with the next catalyst being S&P Global PMIs on Sep 23 (Timeframe: 1-3 weeks through Sep 30 quarter-end window dressing; the Sep 23 PMI data provides the immediate catalyst test for the consolidation breakout, with quarter-end institutional rebalancing flows (JPMorgan estimates $165B equity-to-bond rotation creating headwinds) needing to be absorbed before a sustained push higher into early October when Q3 earnings season begins)
This week's edge: The market may be overweighting September seasonal anxiety and the 10Y yield above 5% as structural headwinds while underweighting the dramatic institutional positioning shift (COT net longs +61% weekly to 83.5th percentile) and the extreme retail bearishness (-24.5% AAII spread) that together form a textbook bullish divergence — sophisticated money is accumulating what the crowd is selling at levels where the forward P/E of 25.17 already discounts the rate headwind; the approaching quarter-end window dressing on Sep 30 provides a mechanical catalyst for rotation into quality growth names that could trigger a squeeze above 30,000
Risk Environment
With vol compressed to the 22th percentile, NQ futures is in the kind of quiet period that tends to end abruptly when a catalyst arrives. Volatility is contracting, with realised vol declining across timeframes. Compressed volatility often precedes sharp directional moves as energy builds.
Low-normal volatility regime (22nd percentile) suggests 0.7-0.9x normal daily ranges of approximately 180-230 points on average; the 12.8% realized vol implies average daily ranges of ~240 points; breakouts above 29,970 or breakdowns below 29,500 carry moderate sustainability risk given contracted vol, though the positive gamma regime from dealer positioning provides structural stability that supports range-bound consolidation
Looking Forward
All eyes turn to S&P Global Composite PMI (Sep) with estimate 55.2 vs previous 56.0, alongside Manufacturing PMI estimate 53.6 vs 53.9 and Services PMI estimate 56.0 vs 56.5 — high-impact data testing whether the US economy maintains expansion momentum through Q3 2026, directly influencing duration-sensitive tech valuations as 10Y yield tests 5.01% on Wednesday 23 September, which carries enough weight to force a decisive directional move.
The week ahead for Nasdaq 100 futures hinges on whether the prevailing consolidating regime can absorb the scheduled catalysts without a regime shift.
This analysis covers one dimension. Our full weekly report combines six specialist agents into a single actionable briefing with directional bias, key levels, and risk-opportunity matrix.
Start Free — Get the Market of the WeekFree weekly report · No credit card · Upgrade anytime