Russell 2000 COT & Institutional Positioning — Smart Money Analysis
Russell 2000 institutional positioning: COT data, sentiment analysis and smart money flow assessment.

Where Institutions Stand
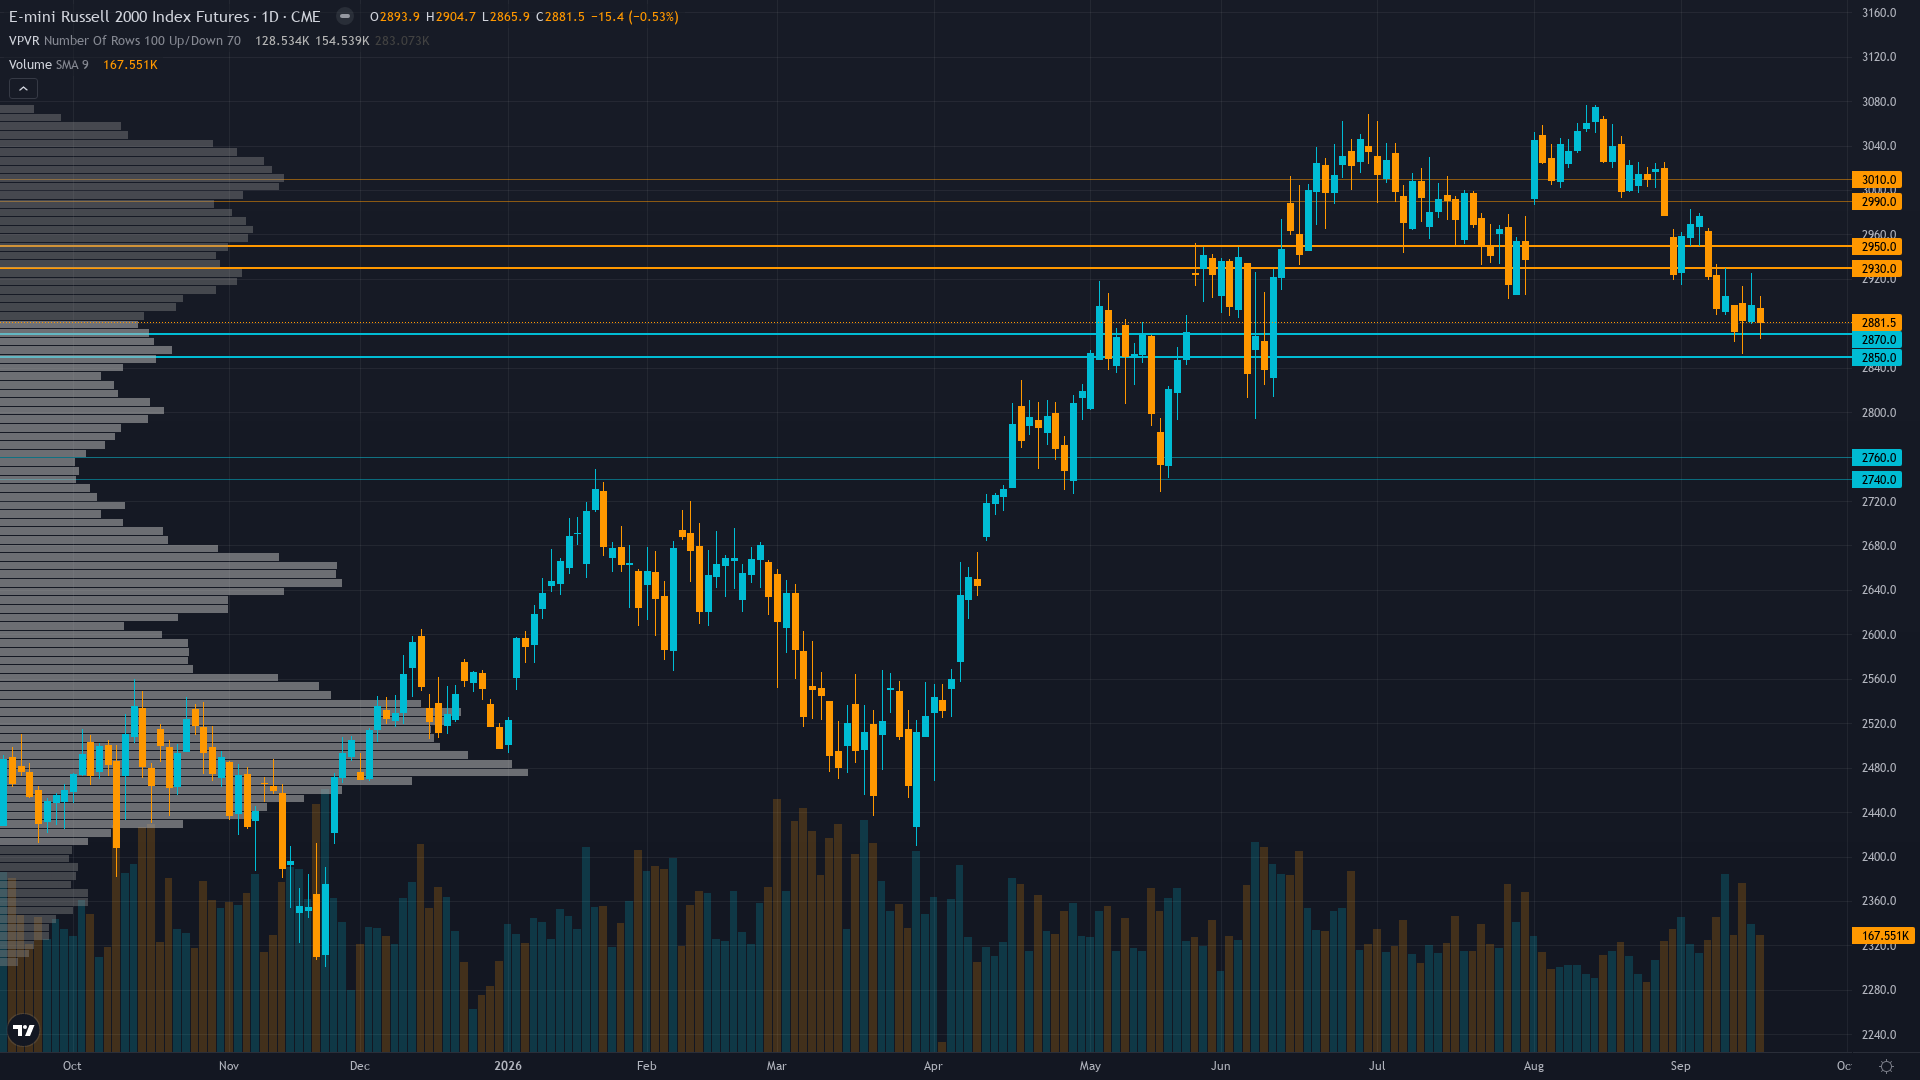
Russell 2000 holds at 2873.23, off 0.53% in a modest retracement from recent levels.
Non-commercial net short -72,350 contracts as of Sep 15 (5.7th percentile of 3-year, -14.6% of OI), extreme bearish but reduced by 10,485 contracts week-over-week as shorts begin covering into the ongoing decline — commercial traders net long 68,683 contracts providing the counterparty; the 5.7th percentile remains historically extreme and represents a massive contrarian squeeze setup, though the current price action shows fundamental selling pressure overwhelming the early covering dynamics
Consensus vs MAD View
Market consensus: Small-caps in an accelerating downtrend with sustained breakdown below 2,900, driven by rising rates and slowing PMI expectations, though extreme speculative short positioning at 5.7th percentile creates latent squeeze risk that early covering activity has not yet resolved
Primary driver: Sustained technical breakdown below 2900 psychological support with RTY down -5.48% in 1M and -1.08% in the past week alone, driven by rising 10Y Treasury yields at 5.01% (highest since late August, +5bp in 1W) creating acute headwinds for credit-sensitive small-cap balance sheets carrying floating-rate debt — the 2s10s curve at +25bp confirms the normalizing yield environment that is structurally negative for RTY as a credit instrument per Section 3 asset-specific context
Where the Crowd May Be Wrong
The desk sees mild-to-moderate divergence from consensus: the market is pricing a linear small-cap selloff on rising rates and slowing PMI, while the desk recognizes the 5.7th percentile COT short positioning and early covering activity (-10,485 contracts) as a latent squeeze setup that is building under the surface but has not yet overwhelmed fundamental headwinds — this is a nuance in magnitude and timing rather than a full directional divergence, as both desk and consensus recognize the bearish trajectory
Crowd Psychology
Neither side has committed heavily to Russell 2000 futures, leaving sentiment in a neutral zone that offers little directional guidance on its own.
Options Flow
RTY options IV at 16.95% with VIX at 14.81, showing a modest premium for small-cap uncertainty versus broad market, but the gap between VIX (14.81) and what is likely an elevated RVX (~18-20) confirms elevated small-cap-specific fear that is directionally consistent with the ongoing breakdown — insufficient directional put/call data available but the vol structure suggests defensive positioning without panic
The Bottom Line on Positioning
The positioning mosaic for Russell index combines fear sentiment with expanding volatility conditions. Trend strength registers at 7/10, suggesting meaningful but not extreme directional bias. Taken together, institutional behaviour, crowd psychology, and derivatives data frame the setup heading into the new week.
This analysis covers one dimension. Our full weekly report combines six specialist agents into a single actionable briefing with directional bias, key levels, and risk-opportunity matrix.
Start Free — Get the Market of the WeekFree weekly report · No credit card · Upgrade anytime