Nasdaq 100 Forecast This Week — Outlook, Drivers & Key Levels
This week's Nasdaq 100 outlook: key drivers, volatility context, risk-opportunity assessment and the week ahead.

This Week's Starting Point
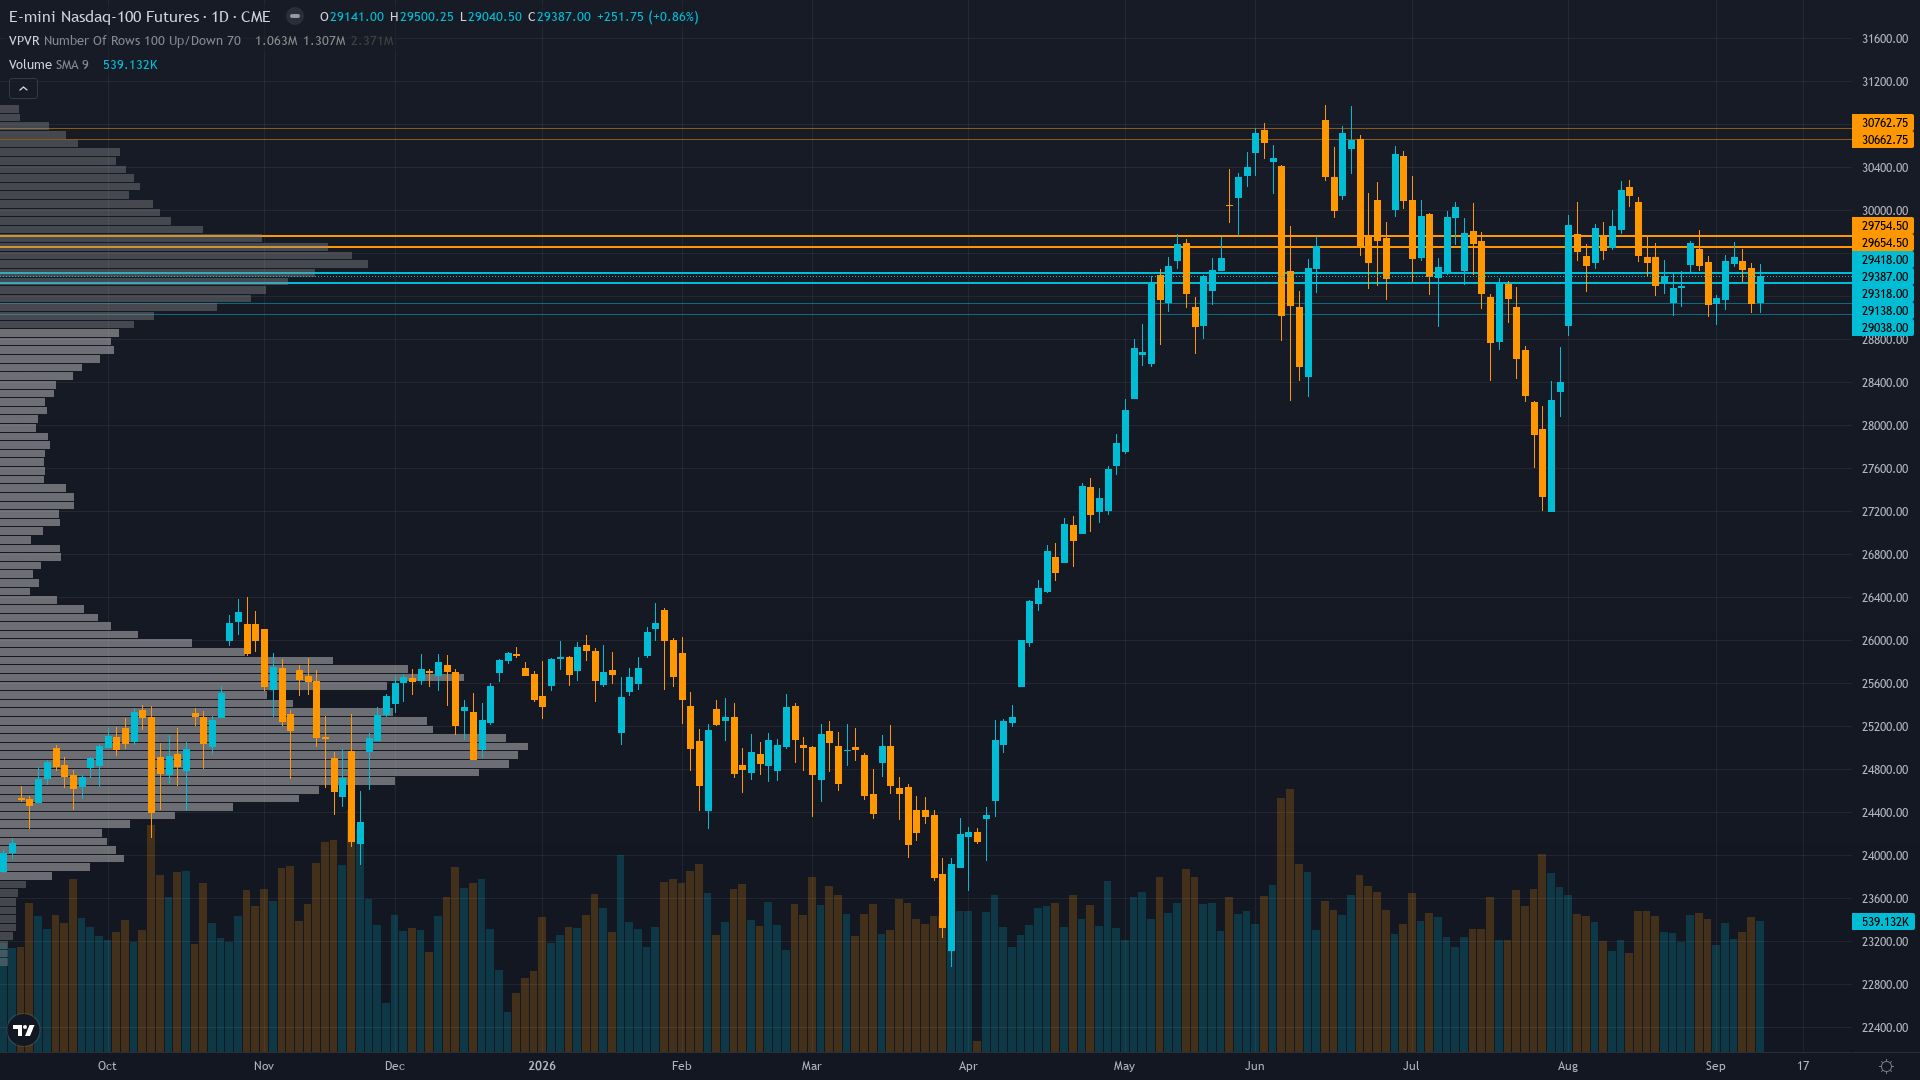
Nasdaq 100 is trading at 29387, up a modest 0.86% as the market edges higher. Price action in Nasdaq 100 futures has compressed into a consolidation pattern, typically a precursor to a directional breakout.
Cautiously defensive with broad acknowledgment that August CPI above expectations has materially increased September FOMC hike odds to ~66-70%, 10Y at 4.96% pressuring tech multiples, and institutional flows turning defensive with speculative long liquidation, though the 34-40% hold probability and positive gamma regime provide contained downside support near 29,000
Forces in Play
Primary driver: FOMC Sep 15-16 binary event looms with market pricing ~66-70% probability of a 25bp hike after August CPI printed +0.4% MoM (above expectations) on Sep 11, the highest rate hike probability since the July rate hold with 9-3 divided vote
Secondary factor: 10Y Treasury yield surged 18bp in the past week to 4.96%, creating material duration-sensitive headwinds for mega-cap tech multiples, while NQ has already declined -1.56% MTD tracking the worst-performing month (September, avg -1.7% for NDX per MarketFramework)
Additional influence: Institutional positioning has shifted decisively defensive with non-commercial net longs slashed by 4,995 contracts (-19.3%) to 20,895 contracts (60.8th percentile) per CFTC COT Sep 8, while commercial hedgers maintain near-record net short -41,018 contracts creating squeeze potential but also signaling institutional skepticism at current levels
Economic backdrop: TRANSITIONAL regime: August CPI +0.4% MoM (above expectations, annual rate 2.36%), PPI +0.4% final demand with goods surge of +1.1%, Fed watch pricing ~66-70% Sep 16 hike probability, 10Y at 4.96% up 18bp weekly, oil above $100/bbl, unemployment at 4.1% stable, retail sales data due Sep 16 alongside FOMC decision
Fundamental assessment: Nasdaq-100 forward P/E of ~29.04 represents moderate overvaluation in a rising rate environment (10Y at 4.96%), AI capex cycle at $725B provides structural support but CapEx peak scenario remains primary risk as monetization evidence is still pending in Q3 2026 earnings season starting October
Technical Landscape
Consolidating at 29,387 within a 29,000-29,500 range, price sits below the key 29,500 psychological resistance but above the 200-day MA around 28,500, RSI neutral 45-50 with no directional conviction, daily trend neutral-to-slightly-bearish with lower highs since the Aug 29 high of 29,704
Trend strength is low at 3/10, indicating weak directional conviction and potential for range-bound behaviour.
Risk-Reward Assessment
Primary risk: FOMC delivers 25bp hike on Sep 16 (66-70% probability) with hawkish dot plot projecting additional tightening, triggering NQ breakdown below 29,000 put wall support toward 28,500 200-day MA as duration-sensitive tech multiples compress from already elevated 29x forward P/E with 10Y above 5%, amplified by aggressive speculative long liquidation (-19.3% COT reduction in prior week accelerating) (Probability: medium)
Primary opportunity: FOMC delivers hold with balanced guidance despite CPI upside surprise, triggering short-covering rally above 29,500 resistance toward 30,000 as markets price the 34-40% tail probability scenario, with positive gamma regime ($759.9M) dampening downside and providing dealer-driven stability supporting a squeeze into quarter-end window dressing (Timeframe: 1-2 weeks through Sep 16 FOMC resolution followed by Sep 18 monthly options expiration (OpEx) which could amplify gamma-driven moves at the 29,000-29,500 strike concentrations)
This week's edge: Signal at 0.1 falls well below 1.0 Min Signal threshold — no directional call this week despite the clear shift in FOMC pricing and institutional defensive positioning, as the binary nature of the Sep 15-16 meeting (66-70% hike vs 30-34% hold) creates a true coin-flip event where pre-positioning is hazardous; the desk notes that the +8.9 vol risk premium (IV 21.3% vs HV20 12.4%) is the widest in months and represents potential overpricing of FOMC tail risk, but this is insufficient for a contrarian directional call given the clear inflation-driven macro headwind and the lack of any catalyst to prove that the market is wrong about the rate path
Risk Environment
With vol compressed to the 22th percentile, NQ futures is in the kind of quiet period that tends to end abruptly when a catalyst arrives. Volatility is contracting, with realised vol declining across timeframes. Compressed volatility often precedes sharp directional moves as energy builds.
Low-normal vol regime (22nd percentile) but with elevated IV creating expensive options; realized 12.4% implies average daily range of ~230 points, while ATM IV at 21.3% implies options are pricing ~400 point daily expected moves; this disconnect means cash/futures trading suggests ~200 point daily ranges while options imply binary catalyst risk; practical implication: standard NQ position sizing appropriate with 200-250 point daily ranges normal, but Sep 16 could produce 500+ point range on FOMC
Looking Forward
All eyes turn to NY Empire State Manufacturing Index (Sep) plus FOMC meeting begins Sep 15 with rate decision and economic projections on Sep 16 at 18:00 ET — the binary event of the week as markets price ~66-70% probability of 25bp hike to 3.75-3.88% after August CPI came in above expectations on Tuesday 15 September, which carries enough weight to force a decisive directional move.
The week ahead for Nasdaq 100 futures hinges on whether the prevailing consolidating regime can absorb the scheduled catalysts without a regime shift.
This analysis covers one dimension. Our full weekly report combines six specialist agents into a single actionable briefing with directional bias, key levels, and risk-opportunity matrix.
Start Free — Get the Market of the WeekFree weekly report · No credit card · Upgrade anytime


