Nasdaq 100 Forecast This Week — Outlook, Drivers & Key Levels
This week's Nasdaq 100 outlook: key drivers, volatility context, risk-opportunity assessment and the week ahead.

Current Market Picture
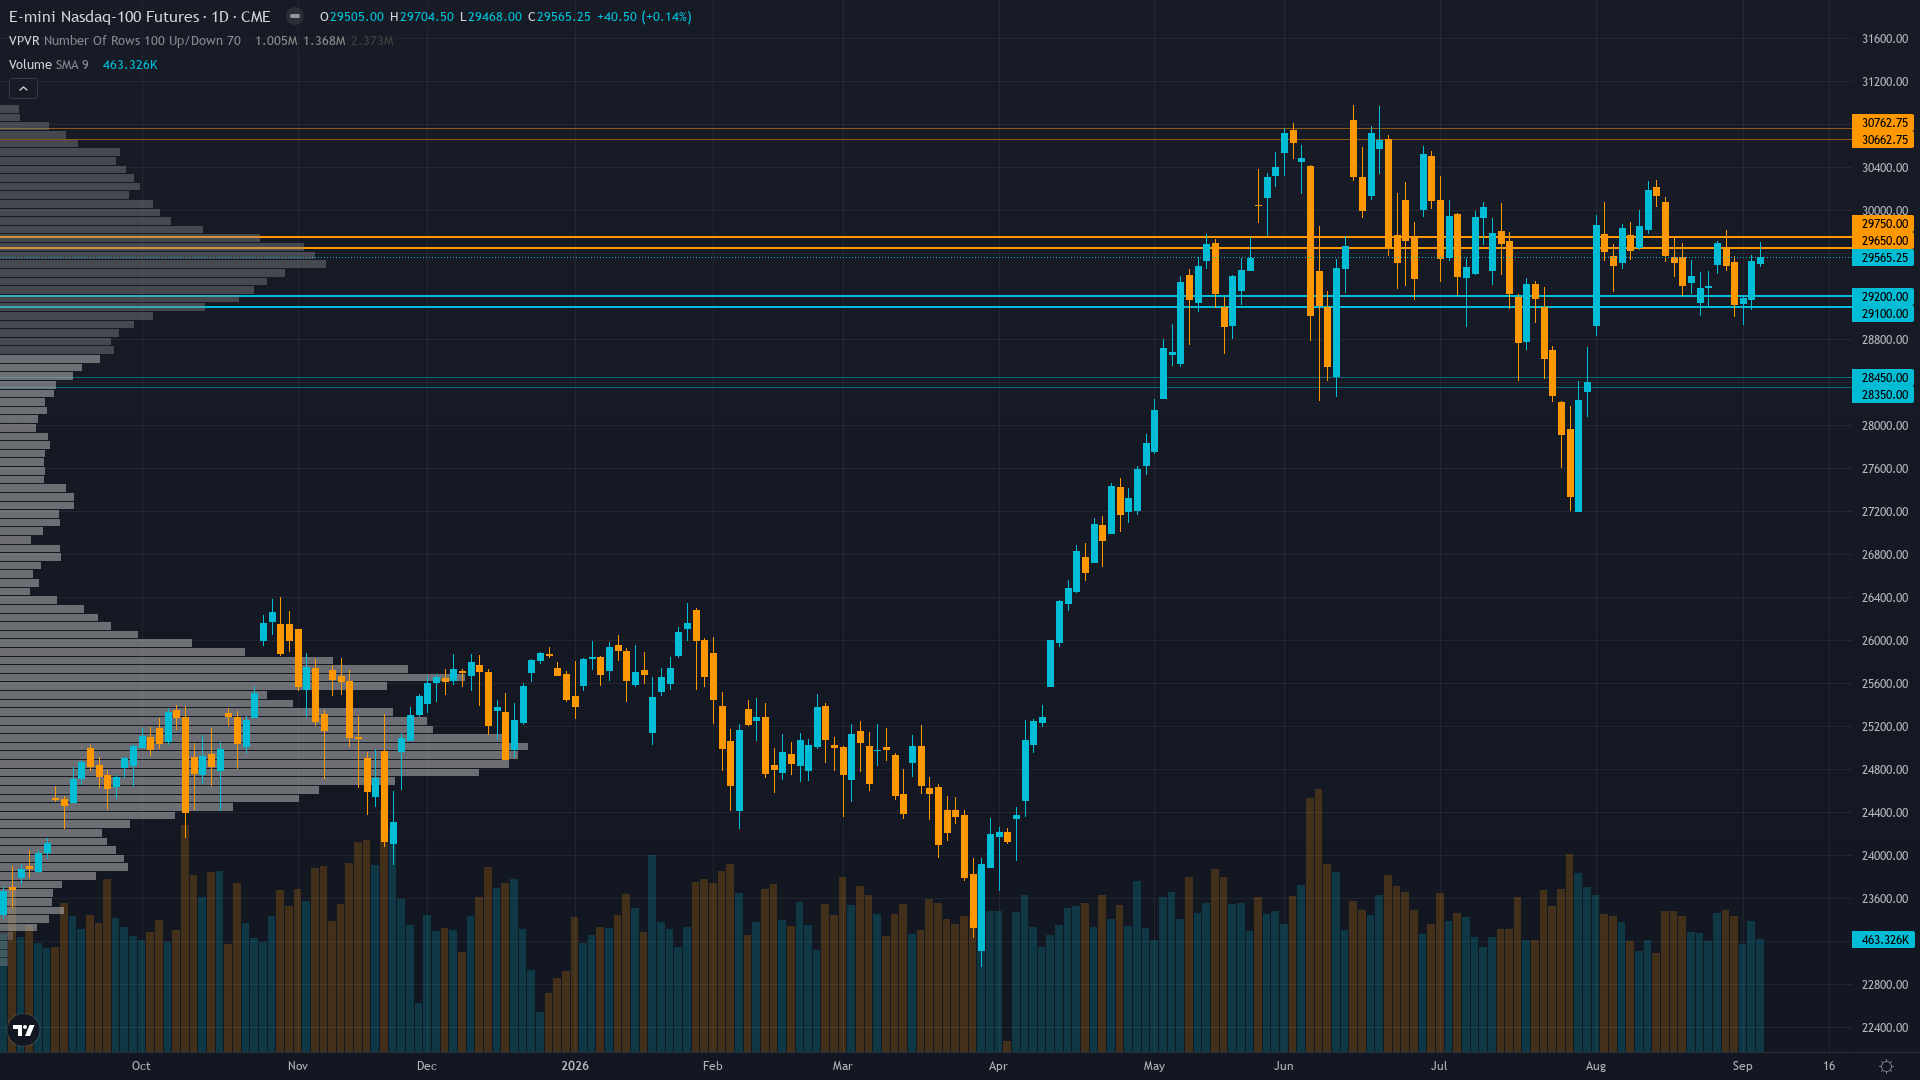
Nasdaq 100 is trading at 29565.25, up a modest 0.14% as the market edges higher. The market in Nasdaq 100 futures is coiling, with narrowing price ranges suggesting stored energy that will eventually release.
Constructive but cautious — consensus acknowledges improving institutional positioning (COT +15,851 contracts, 72.2nd percentile) and stable macro backdrop with VIX at 14.32, while flagging September seasonal headwinds (-2.1% average for NDX per Motley Fool), consolidation below 50-day MA, and upcoming PPI/CPI binary catalysts on Sep 10-11 as reasons to maintain tactical caution
Key Drivers This Week
Primary driver: Synthesized signal at 0.94 falls below the 1.0 Min Signal threshold per Rule 2, mandating NO CALL despite constructive confluence across Institutional (COT +15,851 contracts to net long +25,890 at 72.2nd percentile), Sentiment (improving AAII bull-bear spread positive for first time in 2026), and stable macro backdrop with VIX at 14.32
Secondary factor: PPI (Aug) due Sep 10 and CPI (Aug) due Sep 11 represent the dominant binary catalysts for the week ahead — these inflation prints will test the disinflation narrative (CPI estimate 334.14 vs prior 332.81) and directly influence the September FOMC rate trajectory, with markets pricing 51% probability of 25bp hike per Polymarket
Additional influence: September seasonality remains a material headwind with Nasdaq-100 averaging -2.1% in September (2017-2025 per Motley Fool Aug 28), combining with technical structure that shows NQ at 29,565 below the 50-day MA at ~29,673 while holding above the 200-day MA at ~29,088, creating contested technical territory
Economic backdrop: RISK-ON regime: VIX at 14.32 well below 20 threshold, HY credit spreads tightening at 2.65%, Fed on hold at 3.63% with inflation contained at 2.35%, unemployment at 4.1%; 10Y yield at 4.78% up 5bp weekly exerting modest duration pressure on tech multiples; AI capex cycle at $690B+ provides structural support; PPI (Sep 10) and CPI (Sep 11) are the critical near-term catalysts for rate path clarity
Fundamental assessment: Nasdaq 100 P/E at 28.22 (2.6% below historical average 28.98) representing fair value with forward P/E ~25.17; AI capex cycle remains intact at $690B+ projected hyperscaler spending in 2026 supporting 16-17% earnings growth; no new fundamental catalyst this week; CapEx peak scenario where AI infrastructure spending decelerates before revenue conversion remains primary fundamental risk
Price Structure
Consolidating at 29,565 after opening at 29,505 with intraday range 29,468-29,704.50; price sits below 50-day MA (~29,673, Sell signal per Investing.com) but above 200-day MA (~29,088, Buy signal per Investing.com); RSI at 42.18 neutral-to-slightly-oversold on the cash index while futures show 'Strong Buy' signal per Investing.com creating mixed technical read; MACD negative at -107.53 on cash index
Trend strength at 4/10 paints a picture of a market with some direction but lacking strong conviction.
Upside & Downside
Primary risk: September seasonal weakness (-2.1% average for Nasdaq-100 per 2017-2025 data) combining with PPI/CPI upside surprises that revive Fed rate hike fears could trigger breakdown below 200-day MA support at 29,088 toward 29,000 psychological level, amplified by crowded long positioning (COT at 72.2nd percentile) creating liquidation risk if inflation prints disappoint disinflation narrative (Probability: medium)
Primary opportunity: Constructive institutional positioning tailwind — non-commercials added +15,851 net long contracts (158% weekly increase) to 72.2nd percentile, representing accelerating trend-following momentum; combined with VIX at 14.32 near 52-week lows (13.38) suggesting complacency that historically breaks to the upside; soft PPI/CPI prints could trigger squeeze above 50-day MA at 29,673 toward 30,000 resistance (Timeframe: 1-2 weeks as PPI (Sep 10) and CPI (Sep 11) provide the proximate binary catalysts; constructive institutional flows suggest medium-term bullish structure, but September seasonal drag and consolidation below 50-day MA limit short-term upside until inflation data provides directional clarity)
This week's edge: Signal at 0.94 falls just below 1.0 Min Signal threshold — no directional call this week despite constructive confluence across Institutional (COT +15,851, 72.2nd percentile representing accelerating trend-following momentum), Sentiment (AAII bull-bear spread positive for first time in 2026, F&G 42 in fear territory with room to improve), and Economic (RISK-ON regime, VIX 14.32, contained inflation 2.35%), offset by powerful September seasonal headwind (-2.1% average NDX decline per 2017-2025 data), consolidation below 50-day MA (~29,673), and binary PPI/CPI catalysts that could swing either direction; the market may be underweighting the magnitude of the COT positioning acceleration (+15,851 contracts, +158% weekly) as a structural bullish tailwind for September, but the seasonal drag and technical consolidation beneath key moving averages create offsetting risk that prevents conviction above the Min Signal threshold
Volatility Context
At the 22th percentile, NQ futures volatility is unusually subdued, creating conditions that historically precede sharp directional moves. Realised vol is declining steadily, compressing into ranges that tend to snap when a catalyst breaks the equilibrium.
Normal volatility regime (22nd percentile, low end of normal) suggests 0.8-1.0x normal daily ranges of 200-250 points; current 20-day realized vol of 12.5% implies average daily range of ~235 points; the positive vol risk premium (IV 18.46% vs realized 12.5%) indicates options are pricing event risk for PPI/CPI, meaning breakout days of 400+ points are possible around Sep 10-11 but in the context of contracted vol, these moves have lower follow-through probability
Week Ahead Outlook
The next major catalyst is Producer Price Index MoM (Aug) released Sep 10 at 12:30 ET with estimate 0.3% vs previous 0.0% — high-impact binary event testing whether producer-level inflation pressures are re-emerging following the prior month's flat reading, directly influencing September FOMC rate expectations and duration-sensitive tech valuations on Thursday 10 September — a high-impact event that could materially shift the directional picture.
For tech futures, the balance between existing momentum and scheduled risk events sets the stage for the week ahead.
This analysis covers one dimension. Our full weekly report combines six specialist agents into a single actionable briefing with directional bias, key levels, and risk-opportunity matrix.
Start Free — Get the Market of the WeekFree weekly report · No credit card · Upgrade anytime



