Nasdaq 100 Forecast This Week — Outlook, Drivers & Key Levels
This week's Nasdaq 100 outlook: key drivers, volatility context, risk-opportunity assessment and the week ahead.

This Week's Starting Point
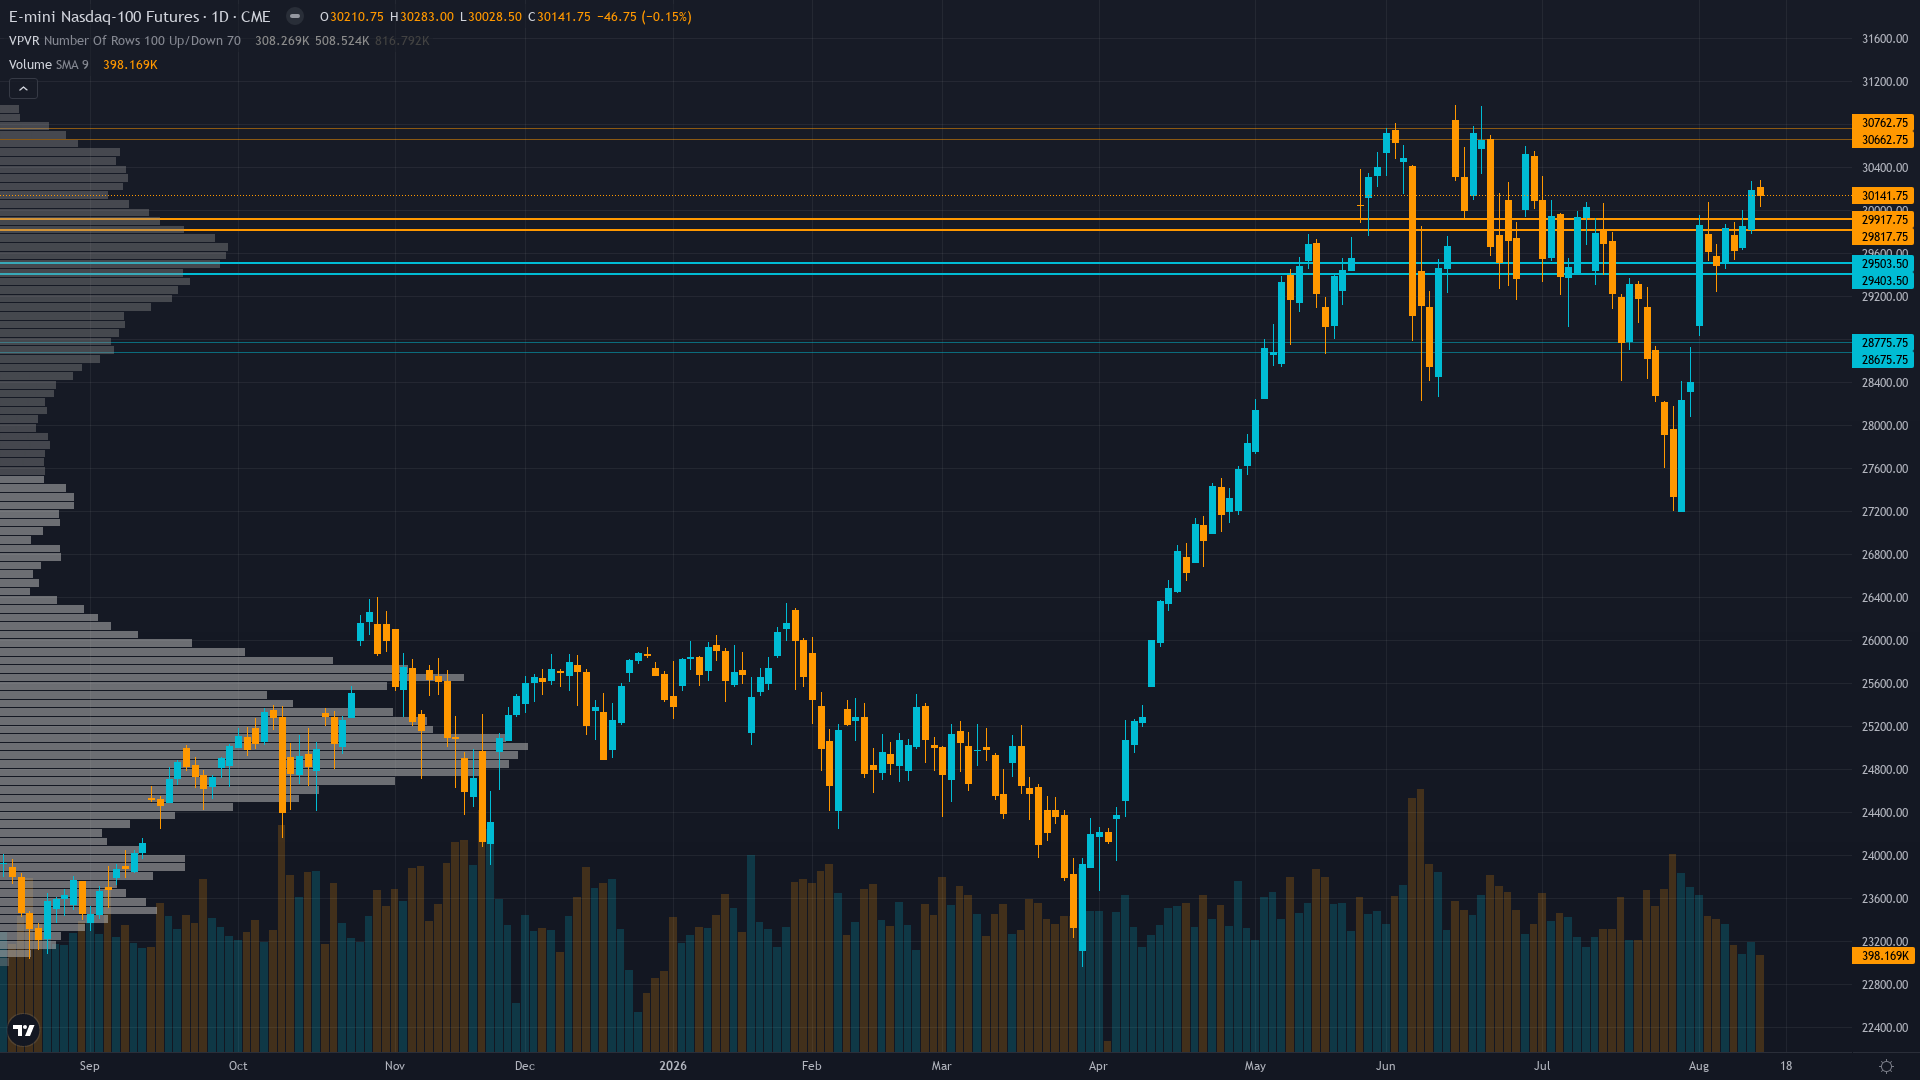
Nasdaq 100 is trading at 30141.75, down 0.15% in a measured pullback. Price action in Nasdaq 100 futures has compressed into a consolidation pattern, typically a precursor to a directional breakout.
Broadly constructive with consensus acknowledging stable macro (contained CPI, Fed on hold) and AI-driven earnings momentum supporting tech, while noting record COT short positioning creates binary squeeze risk and VIX complacency leaves market exposed to sentiment shocks
Forces in Play
Primary driver: COT extreme short positioning at 0th percentile (-39,302 contracts, -13.9% of OI) creating powerful contrarian squeeze setup against a RISK-ON macro regime, but discipline signals are too mixed to produce directional conviction above the 1.0 Min Signal threshold
Secondary factor: VIX at 14.55-14.63 entrenched complacency with NQ ATM IV at 14.9% well below 20-day realized vol of 23%, indicating options are pricing cheap volatility relative to actual market moves, historically resolving via vol expansion in direction of the trend
Additional influence: August CPI data (July 2026) released August 12 showed inflation at 2.27% (contained), reinforcing Fed patience narrative with funds rate steady at 3.63%, while NVIDIA earnings on August 26 represent the next binary catalyst for AI capex thesis validation
Economic backdrop: RISK-ON regime: VIX at 14.55 (well below 20), HY credit spreads at 271bps tightening, Fed on hold at 3.63% with inflation contained at 2.27%, unemployment at 4.1%, recession probability at 0.6%; AI infrastructure capex at $775-800B providing structural support for tech; Housing Starts and Industrial Production catalysts Aug 18
Fundamental assessment: Nasdaq 100 forward P/E at 29.16 (5.8% above historical 27.56 average) representing modest overvaluation potentially justified by AI-driven earnings growth; no fresh earnings catalyst this week but NVIDIA Aug 26 pivotal; AI capex cycle at $775-800B in 2026 providing structural demand support
Technical Landscape
Bullish trend intact with price at 30,142 well above both 50-day MA (~29,000) and 200-day MA (~29,064), positioned at 92.5% of 52-week range with RSI 61-64 neutral-to-slightly-overbought; consolidating in 29,861-30,283 range beneath 30,713 all-time high with no bearish divergence pattern
Trend strength registers at 6/10, suggesting meaningful but not extreme directional bias.
Risk-Reward Assessment
Primary risk: Breakdown below 29,861 immediate support triggers profit-taking toward 29,553 as momentum exhaustion from 3.13% MTD gain combines with low VIX complacency (14.55) leaving market vulnerable to sentiment shock; 10Y yield at 4.68% with steepening curve (2s10s at 51bp) pressures duration-sensitive tech multiples; Sentiment at greed levels (F&G 65) lacks fear-driven bid (Probability: medium)
Primary opportunity: Extreme COT short positioning at 0th percentile (-39,302 contracts, -13.9% of OI) combined with negative vol risk premium (IV 14.9% vs realized 23%) creates asymmetric squeeze potential if NQ breaks above 30,283 resistance toward 30,713 all-time high; forced covering of record speculative shorts could drive violent 3-5% rally as dealers amplify moves through gamma dynamics (Timeframe: 1-3 weeks as NVIDIA earnings Aug 26 provide catalyst for AI thesis reaffirmation; August seasonality 65% positive for NDX with +1% average gains; break above 30,283 resistance would trigger stop-running and short covering in thin summer liquidity)
This week's edge: The market may be underweighting the historical extremity of the COT setup: non-commercial net position at 0th percentile of 3-year range (-39,302 contracts, -13.9% of OI) with a -24,663 contract weekly contraction while price rallies — this divergence between record speculative bearish positioning and bullish price action creates asymmetric upside potential that is not reflected in current option pricing (IV 14.9% vs realized 23%). However, signal at 0.75 falls below 1.0 Min Signal threshold per Rule 2, limiting directional conviction to NO CALL
Risk Environment
With vol at the 58th percentile over 90 days, NQ futures is in a measured regime that doesn't require unusual adjustments. Volatility is contracting, with realised vol declining across timeframes. Compressed volatility often precedes sharp directional moves as energy builds.
Normal volatility regime (58th percentile) suggests 1.0-1.2x normal daily ranges; expect 350-450 point daily swings versus normal 250-300 ranges given elevated 20-day realized (23%); the gap between low IV (14.9%) and high realized (23%) means options are cheap for directional positioning but also signal potential for range-bound chop; squeeze potential suggests 600+ point days if 30,283 breaks
Looking Forward
All eyes turn to Housing Starts and Building Permits for July 2026 (12:30 ET) plus Industrial Production MoM (13:15 ET) — high-impact data testing whether growth narrative remains intact; Housing Starts estimate 1.35M vs prior 1.427M, Industrial Production estimate +0.3% vs prior +0.1% on Tuesday 18 August, which carries enough weight to force a decisive directional move.
The week ahead for Nasdaq 100 futures hinges on whether the prevailing consolidating regime can absorb the scheduled catalysts without a regime shift.
This analysis covers one dimension. Our full weekly report combines six specialist agents into a single actionable briefing with directional bias, key levels, and risk-opportunity matrix.
Start Free — Get the Market of the WeekFree weekly report · No credit card · Upgrade anytime



