Nasdaq 100 Forecast This Week — Outlook, Drivers & Key Levels
This week's Nasdaq 100 outlook: key drivers, volatility context, risk-opportunity assessment and the week ahead.

Current Market Picture
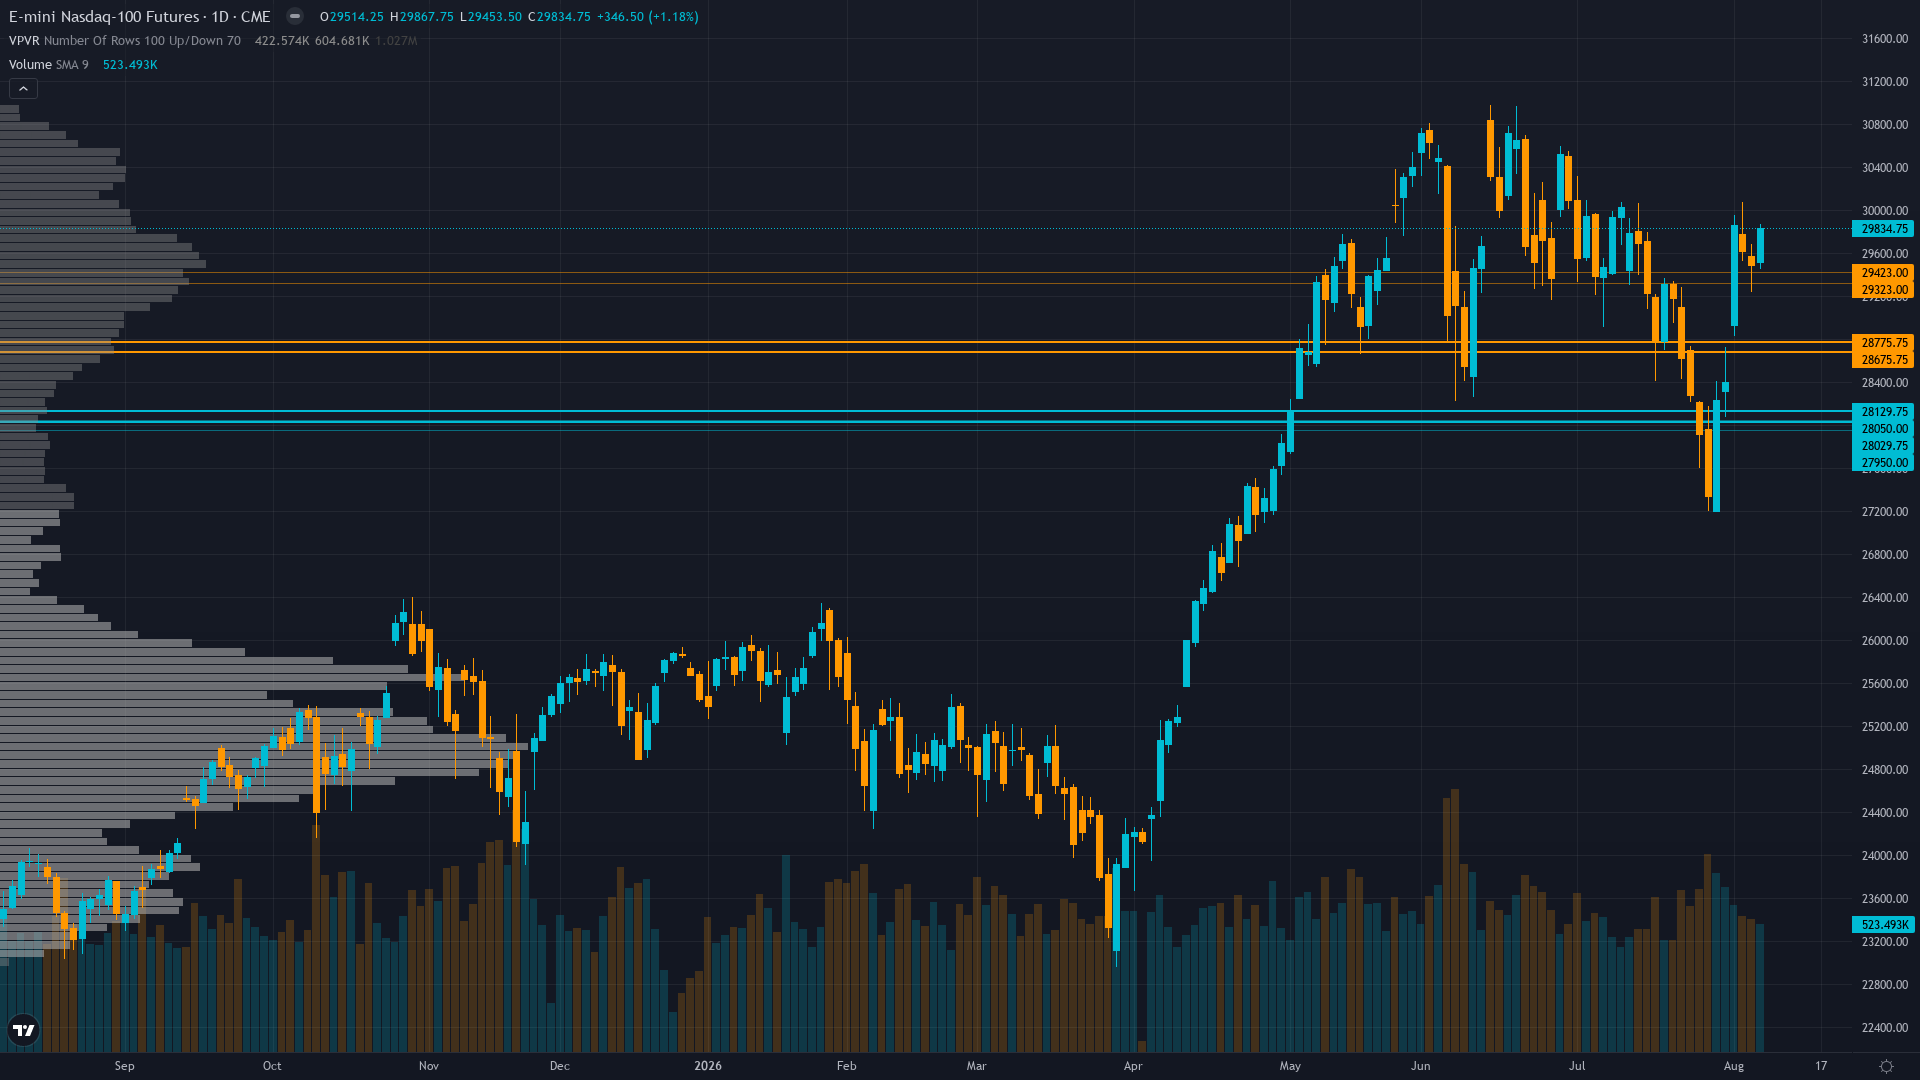
Nasdaq 100 is trading at 29834.75, up 1.18% in the last 24 hours as buyers maintain control. Directional momentum continues to define Nasdaq 100 futures, with the trend firmly in control of price action.
Broadly bullish after best weekly performance since April 2026 with S&P 500 at record close, driven by AI earnings validation and NFP miss reinforcing Fed patience, though August 12 CPI represents binary risk and sentiment shows mix of greed (F&G 63) and lingering caution (AAII -11.1% bearish spread)
Key Drivers This Week
Primary driver: AI-driven tech rally with NQ +5.0% weekly, best since April 2026, as mega-cap earnings validate $725B AI capex cycle and August NFP miss (July payrolls -23K) reinforces Fed patience narrative, with S&P 500 closing at record high on August 7, 2026
Secondary factor: Extreme institutional short positioning (non-commercial net -14,639 contracts, 1.3rd percentile of 3-year range) creating powerful squeeze potential against a +5% weekly rally, with $7.85B QQQ ETF inflows confirming retail/institutional divergence and forced covering catalyst building
Additional influence: Volatility risk premium at -6.9 points (IV 19.1% vs realized 25.3%) with VIX at 15.15 indicating complacency that historically resolves via vol expansion in direction of trend, while $979.6M positive gamma and $31K call wall provide dealer-driven stability
Economic backdrop: RISK-ON regime: VIX at 15.15 (below 20), HY credit spreads at 271bps tightening, Fed on hold at 3.63% with inflation at 2.25% and unemployment at 4.1%; July CPI due Aug 12 (est YoY 3.4% from 3.5%) critical next test; JPMorgan expects rates steady through 2026; AI capex cycle $725B structural support for tech
Fundamental assessment: Nasdaq 100 P/E at 28.81 (4.6% above historical avg 27.54), AI-driven earnings beats exceeding estimates by 55% average, $3.5T market value surge Aug 3-7 supported by hyperscaler AI revenue conversion; primary risk is CapEx peak scenario where infrastructure spend decelerates before revenue catches up
Price Structure
Strong uptrend with price at 29,835 well above 50-day MA (~28,800) and 200-day MA (~27,500), recovering from July correction low of 28,212; RSI nearing overbought ~70 but no bearish divergence; price at 88.4% of 52-week range with 30,000 psychological resistance and 30,713 52-week high within striking distance
Trend strength sits at 7/10, reflecting a market that has directional bias but hasn't reached extreme conviction.
Upside & Downside
Primary risk: CPI upside surprise above 3.4% YoY on August 12 reignites Fed hawkish expectations and rate-hike fears, reversing the rally as duration-sensitive tech multiples compress; VIX spike from 15.15 complacency levels toward 20+ forces unwinding of long gamma positioning and breaks key 30,000 support (Probability: medium)
Primary opportunity: CPI confirmation of disinflation (3.4% or below) drives NQ through 30,000 resistance toward 30,713 52-week high as extreme institutional short covering (non-commercials at 1.3rd percentile, -14,639 contracts) accelerates into forced buying, creating asymmetric upside if speculative shorts get squeezed above 30,000 (Timeframe: 1-2 weeks as August 12 CPI provides the catalyst to either confirm the disinflation narrative and trigger short squeeze above 30,000, or disappoint and reverse the rally; seasonal data shows August positive 65% of time for NDX with average +1% gains providing modest tailwind)
This week's edge: Market may be underweighting the extreme institutional short squeeze setup: non-commercials net short -14,639 contracts at 1.3rd percentile of 3-year range with $7.85B QQQ ETF inflows flowing opposite direction - this divergence between futures positioning (speculative shorts at extreme) and cash market flows (institutional accumulation) creates asymmetric upside if shorts are forced to cover above 30,000, while VIX at 15.15 vs realized vol 25.3% (-6.9 vol risk premium) indicates options market systematically underpricing volatility in the direction of the prevailing trend, creating cheap upside optionality that compounds with any CPI-positive catalyst on August 12
Volatility Context
At the 82th percentile of its 90-day range, NQ futures volatility is running hot, creating both opportunity and risk for directional traders. Realised vol is declining steadily, compressing into ranges that tend to snap when a catalyst breaks the equilibrium.
High volatility at 82nd percentile suggests 1.5-1.8x normal daily ranges; expect 380-480 point daily swings versus normal 250-300; 20-day realized vol of 25.3% implies average daily range of ~475 points; breakouts above 30,000 are more likely to sustain given low IV (19.1%) underestimating actual vol; violent squeeze potential from extreme institutional short positioning could drive 600+ point days
Week Ahead Outlook
The next major catalyst is July CPI YoY release (12:30 ET) with estimate 3.4% (previous 3.5%) and Core CPI YoY at 2.5% (previous 2.6%); high-impact binary event that will test disinflation narrative and Fed patience stance critical for duration-sensitive tech valuations on Wednesday 12 August — a high-impact event that could materially shift the directional picture.
For tech futures, the balance between existing momentum and scheduled risk events sets the stage for the week ahead.
This analysis covers one dimension. Our full weekly report combines six specialist agents into a single actionable briefing with directional bias, key levels, and risk-opportunity matrix.
Start Free — Get the Market of the WeekFree weekly report · No credit card · Upgrade anytime



