Nasdaq 100 Forecast This Week — Outlook, Drivers & Key Levels
This week's Nasdaq 100 outlook: key drivers, volatility context, risk-opportunity assessment and the week ahead.

This Week's Starting Point
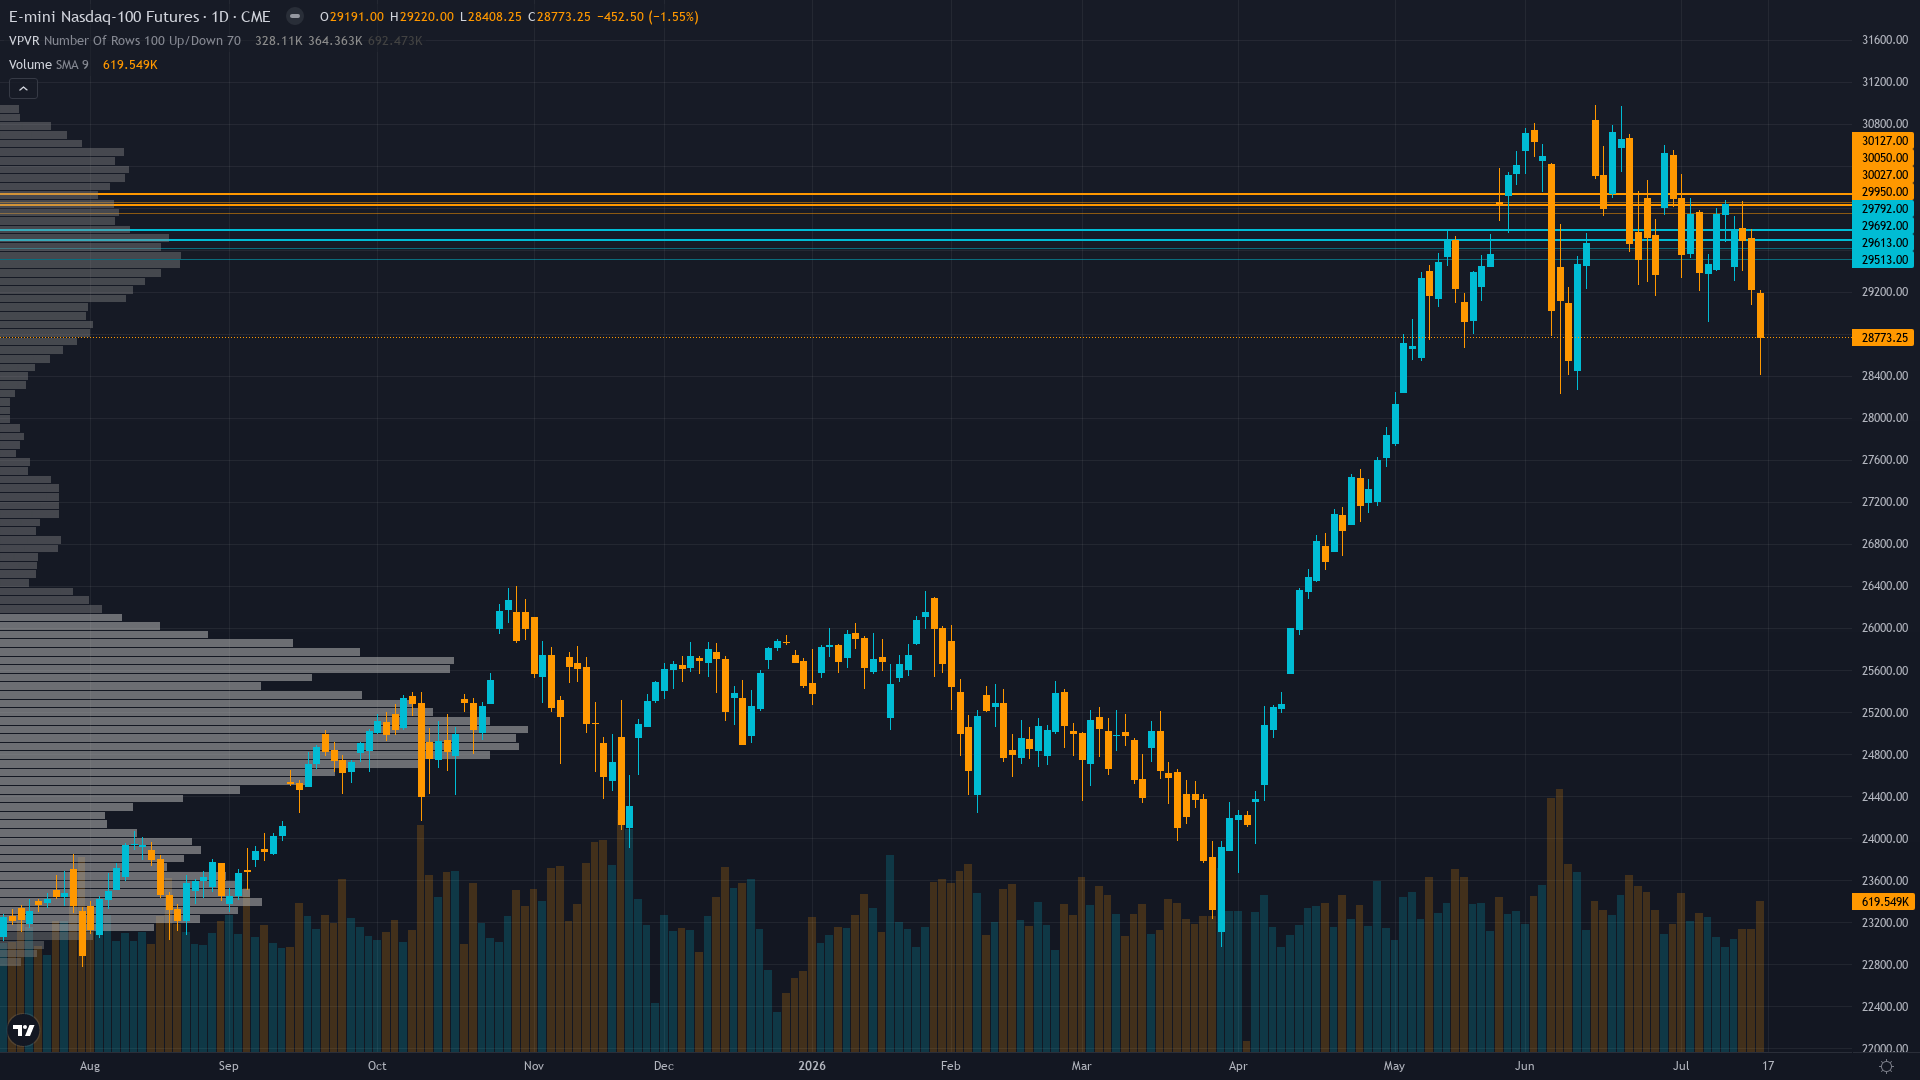
Nasdaq 100 is trading at 28773, down 4.44% as selling pressure weighs on price. Nasdaq 100 futures is in a breaking down market state, requiring careful assessment of current conditions.
Defensively positioned after semiconductor selloff with strategists acknowledging technical damage and AI sustainability concerns but divided on whether this represents sector rotation or start of broader tech correction
Bull & Bear Case
Primary risk: Breakdown below 28,400 critical support triggers acceleration toward 26,282 200-day MA or lower as semiconductor selloff spreads to broader tech, Q2 earnings starting July 22 disappoint on AI monetization, and elevated 31.89x P/E requires multiple compression in environment where market questions sustainability of $700B AI capex beyond 2026 (Probability: high)
Primary opportunity: Hold above 28,400-28,800 support zone combined with Alphabet earnings July 22 validating AI revenue growth and semiconductor selloff stabilizing drives recovery toward 29,400-30,000 resistance as acute fear from chip collapse dissipates within 5-7 day typical repricing window (Timeframe: 1-2 weeks as July 22 Alphabet earnings provide first mega-cap validation test and July 28-29 FOMC offers policy trajectory clarity, with historical 65% probability semiconductor volatility settles within 10 trading days absent additional fundamental catalyst)
This week's edge: Market may be underweighting speed at which semiconductor collapse (-18.2% in July) challenges broader AI infrastructure thesis given $700B capex requires monetization evidence and IDC smartphone warning signals demand weakness, while overweighting near-term VIX compression from 18.77 to 15.67 as fear resolution when equity put/call 0.73 shows insufficient protective positioning for breakdown structure
This Week's Catalysts & Drivers
Primary driver: Semiconductor sector collapse with PHLX chip index down -18.2% in July 2026 triggering NQ technical breakdown below 50-day MA at 29,400, driven by concerns over AI capex sustainability beyond 2026 and IDC forecast of -13% smartphone market decline creating material demand shock
Secondary factor: Technical breakdown confirmed with price at 28,773 falling decisively below 50-day MA (29,400) on massive 811-point intraday range and elevated volume (619K contracts), though still holding above critical 200-day MA at 26,282 preventing full structural failure
Additional influence: VIX spike to 18.77 on July 17 (+12.19%) indicating acute fear event before compressing back to 15.67, while equity put/call ratio remains low at 0.73 showing crowd complacency persists beneath surface volatility creating vulnerability to further downside
Economic backdrop: Fed held at 3.5-3.75% with July 28-29 FOMC 9 days away showing 90% hold probability, weak June NFP +57K vs 110K consensus with unemployment 4.2%, ISM Manufacturing 52.7 expansionary, AI capex cycle sustainability now questioned after chip selloff
Fundamental assessment: Moderately overvalued at P/E 31.89 (10.3% above average), Q2 earnings begin July 22 with major tech reporting July 22-30, $700B AI capex sustainability now questioned after semiconductor sector collapse, elevated valuations require flawless execution amid rising doubts
Technical Picture
Breakdown structure with price at 28,773 decisively below 50-day MA (29,400) after 811-point intraday reversal, still above 200-day MA (26,282) preserving longer-term structure, RSI 46.72 neutral but declining with strong selling volume confirming distribution
At 3/10, trend strength is subdued, suggesting the market lacks a clear directional mandate.
Risk Environment
With vol at the 78th percentile, NQ futures is trading in an elevated regime where daily ranges can surprise even experienced traders. Volatility is expanding, with realised vol rising across timeframes. This typically signals increasing uncertainty and wider daily ranges ahead.
High volatility at 78th percentile suggests 1.5-1.9x normal daily ranges; expect 375-475 point daily swings versus normal 250-300 ranges; breakdowns below 28,400 or recoveries above 29,400 carry moderate sustainability until volatility compresses below 70th percentile, requiring wider stops
Looking Forward
All eyes turn to Alphabet Q2 2026 earnings on July 22, 2026, first major mega-cap tech report of earnings season following semiconductor sector collapse, critical for validating whether AI infrastructure spending translates to revenue growth sufficient to justify elevated valuations after $700B+ capex year on Wednesday 22 July, which carries enough weight to force a decisive directional move.
The week ahead for Nasdaq 100 futures hinges on whether the prevailing breaking down regime can absorb the scheduled catalysts without a regime shift.
This analysis covers one dimension. Our full weekly report combines six specialist agents into a single actionable briefing with directional bias, key levels, and risk-opportunity matrix.
Start Free — Get the Market of the WeekFree weekly report · No credit card · Upgrade anytime



