Nasdaq 100 Forecast This Week — Outlook, Drivers & Key Levels
This week's Nasdaq 100 outlook: key drivers, volatility context, risk-opportunity assessment and the week ahead.

Market Overview
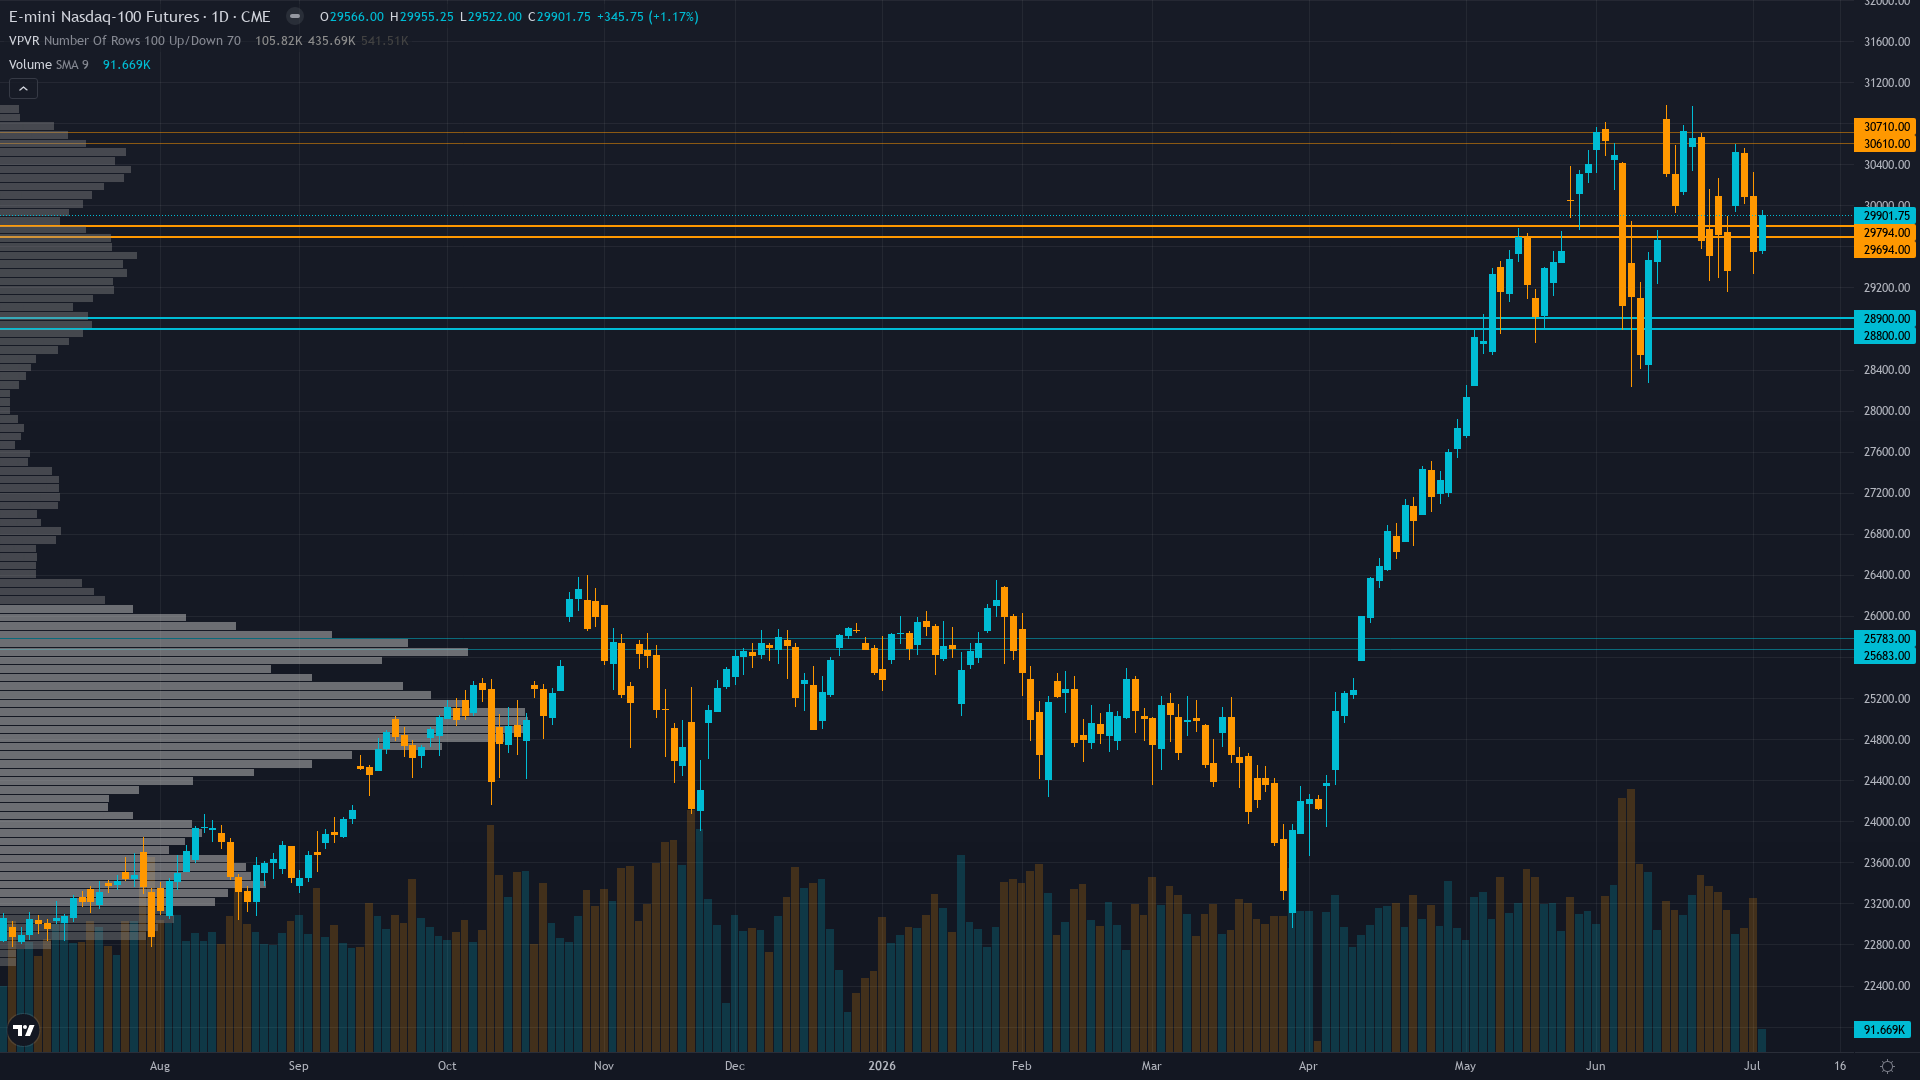
Nasdaq 100 stands at 29901.75, having rallied 2.06% as bulls press their advantage. Nasdaq 100 futures is range-bound and tightening, with decreasing volatility signalling a directional resolution ahead.
Cautiously positioned ahead of Q2 earnings season beginning July 8-11, acknowledging technical consolidation and June hawkish Fed repricing while maintaining constructive view on AI capex validation and structural growth, but defensive given elevated valuations requiring flawless execution
This Week's Catalysts & Drivers
Primary driver: Miss reset requirement triggered after 5 consecutive MISSED calls (July 3, June 26, June 19, June 12, June 5) exceeding 3-miss threshold for EQUITY_INDEX category, mandating NEUTRAL per Rule 5 and overriding all discipline signals regardless of current market structure
Secondary factor: NQ trading at 29,902 after +2.06% weekly recovery from June 28 breakdown low of 28,901, but price remains within contested consolidation zone between broken 50-day MA at 29,563 and 200-day MA at 29,809, indicating no clear directional resolution ahead of Q2 earnings season beginning July 8-11
Additional influence: VIX at 15.81 (well below 20 threshold) and low volatility regime persists despite June's -4.36% decline, while calendar dynamics show quarter-end support evaporated after June 30 and buyback blackout windows beginning for major tech constituents reduce corporate bid ahead of July earnings releases
Economic backdrop: Fed held at 3.50-3.75% after June 17 FOMC, next meeting July 28-29 with 90% hold probability per Polymarket, June NFP +57K weak but unemployment steady at 4.2%, ISM Manufacturing 53.3 showing expansion momentum, AI capex cycle at $700B+ 2026 providing structural support
Fundamental assessment: Trailing P/E 36.17x (25.4% above average) represents overvaluation, forward P/E ~22.4x fair value requires Q2 earnings execution, Q2 earnings season begins July 8-11 with mega-cap tech reporting shortly but no results released as of July 5
Technical Picture
Consolidating at 29,902 between 50-day MA resistance (29,563) and 200-day MA support (29,809) after June breakdown to 28,901, RSI neutral at 50, breadth negative with declining issues outnumbering advancers 1,876 to 1,621 indicating internal weakness
At 5/10, trend strength is middling — enough to suggest a lean, but not enough to trade with high confidence.
Bull & Bear Case
Primary risk: Breakdown below 29,230-28,464 support zone triggers acceleration toward 200-day MA or lower as Q2 earnings disappoint elevated expectations or AI spending fails to translate to revenue/margin expansion at $700B+ capex levels, combining with elevated 36.17x trailing P/E requiring multiple compression in higher-for-longer rate environment (Probability: medium)
Primary opportunity: Hold above 29,230-29,600 support combined with Q2 earnings validating +8.7% IT sector EPS estimate revisions and AI capex sustainability drives recovery toward 30,000-30,230 resistance as June hawkish shock fully absorbs and VIX compression below 15 characteristic of sustained bull trends reasserts with technical structure healing above 50-day MA (Timeframe: 2-3 weeks as Q2 earnings provide fundamental clarity mid-July and July 28-29 FOMC confirms policy stability, with historical 70% probability that post-earnings volatility settles within 10-15 trading days if results meet elevated expectations)
This week's edge: Resetting after 5 consecutive MISSED graded calls (exceeding 3-miss threshold) — thesis under review per mandatory Rule 5 requirement for EQUITY_INDEX category
Volatility Regime
Volatility for NQ futures is at the 58th percentile over 90 days — a normal regime that allows for standard position sizing and conventional trade management. The vol trend is flat, with no meaningful shift across timeframes. Stable vol environments often lull traders before a regime change arrives.
Normal volatility at 58th percentile suggests 1.1-1.3x normal daily ranges; expect 280-340 point daily swings versus normal 250-300 ranges; breakouts above 30,000 or breakdowns below 29,230 carry moderate sustainability as normalized vol allows standard position sizing
What to Watch
The Q2 2026 earnings season begins second week of July with major tech companies (Microsoft, Alphabet, Meta, Apple, Amazon, Nvidia) scheduled to report in mid-July, providing fundamental validation or challenge to elevated valuations and AI monetization thesis on Wednesday 8 July stands as the week's primary risk event — high-impact and capable of overriding the existing technical and sentiment setup.
The interplay between consolidating market conditions and upcoming catalysts will define this week's trading landscape for Nasdaq futures.
This analysis covers one dimension. Our full weekly report combines six specialist agents into a single actionable briefing with directional bias, key levels, and risk-opportunity matrix.
Start Free — Get the Market of the WeekFree weekly report · No credit card · Upgrade anytime



