Nasdaq 100 Forecast This Week — Outlook, Drivers & Key Levels
This week's Nasdaq 100 outlook: key drivers, volatility context, risk-opportunity assessment and the week ahead.

Where Things Stand
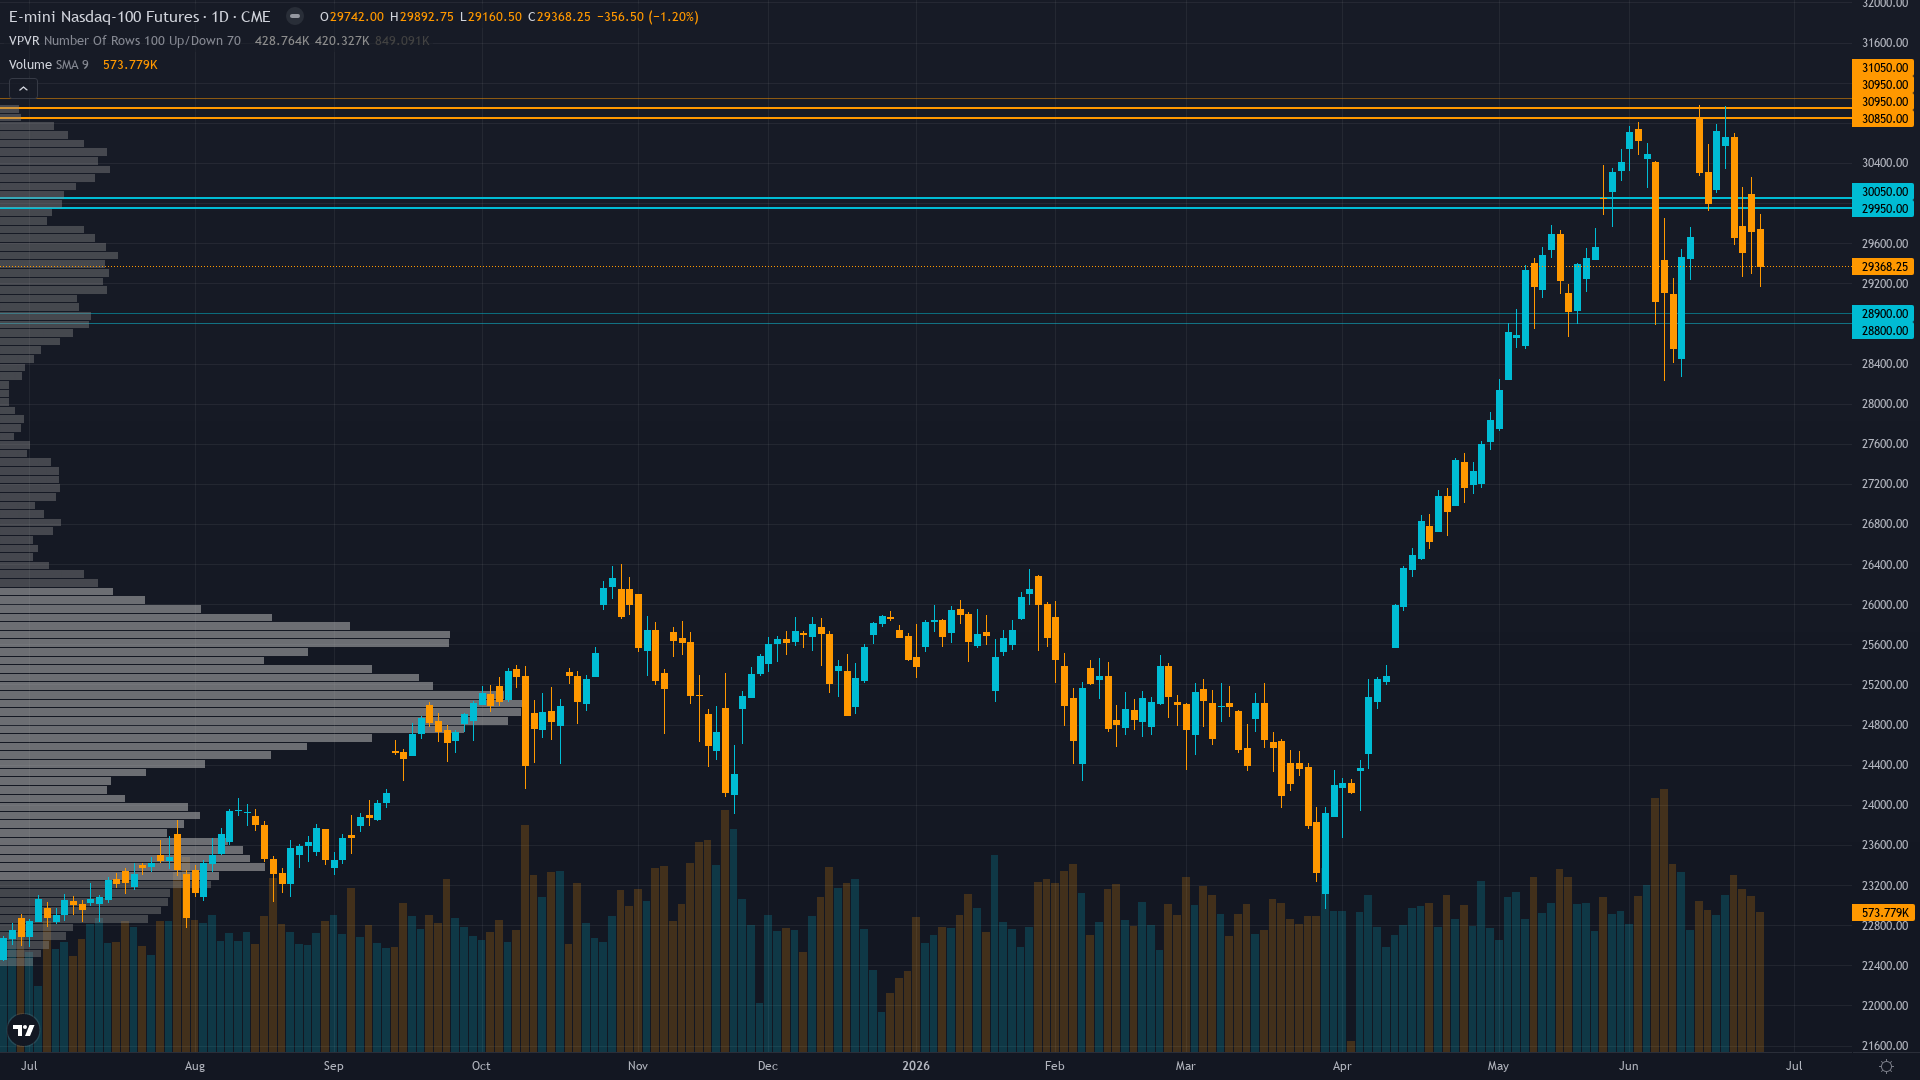
Nasdaq 100 fell to 29298.5 on a 1.20% decline, with selling pressure dominating price action. Nasdaq 100 futures is consolidating, with price compressing into a narrower range as the market builds energy for its next move.
Cautiously defensive acknowledging technical breakdown below 50-day MA and June 17 FOMC hawkish shift removing 2026 rate cut expectations, but not panicked given price still holding above 200-day MA at 25,733 and June 22 rebalancing flows providing structural bid
What's Driving Price
Primary driver: Miss reset requirement triggered after 4 consecutive MISSED calls (June 26, 19, 12, 5) exceeding 3-miss threshold for EQUITY_INDEX category mandates NEUTRAL bias per Rule 5, overriding all discipline signals and technical breakdown below 50-day MA at 29,744
Secondary factor: NQ technical breakdown confirmed with price at 29,298 falling decisively below 50-day MA (29,744) after -4.5% weekly decline through June 25 per Investing.com, with multiple technical indicators showing SELL signal and 200-day MA at 25,733 now critical support 3,565 points below current levels
Additional influence: June 22 Nasdaq-100 quarterly rebalance (6 days ago) added 5 AI infrastructure names including CoreWeave and Astera Labs creating estimated $5-10 billion passive rebalancing flows that may still be settling, while June 17 FOMC hawkish pivot (11 days old) removing dovish bias continues repricing rate expectations
Economic backdrop: Fed held at 3.50-3.75% after June 17 FOMC (11 days ago) with removal of easing language shifting 2026 rate cut expectations from one cut to zero per multiple sources, Manufacturing PMI 55.7 showing expansion acceleration, AI capex cycle at $700B+ 2026 providing structural support, next FOMC July 29
Fundamental assessment: Trailing P/E 35.33x (22.6% above long-term average 28.82) represents moderate overvaluation, forward P/E ~22.4x appears more reasonable, Q2 earnings growth tracking +22% YoY validates AI capex cycle but elevated valuations require flawless execution without fresh catalyst this week
Chart Assessment
Breakdown structure with price at 29,298 below 50-day MA (29,744) after -4.5% weekly decline, still above 200-day MA (25,733) preserving longer-term bull structure, RSI neutral, intraday range 29,184-29,713 showing consolidation after selloff
With trend strength at 5/10, the directional signal is present but far from decisive.
Volatility Context
At the 62th percentile, NQ futures volatility sits in a normal range, neither compressed enough to signal a breakout nor elevated enough to demand caution. Realised vol is trending higher across the curve, which tends to accompany transitional periods where the market is repricing risk.
Normal volatility at 62nd percentile suggests 1.2-1.5x normal daily ranges; expect 300-370 point daily swings versus normal 250-300 ranges; breakouts above 29,744 or breakdowns below 28,850 carry moderate sustainability as normalized vol allows standard position sizing, recent -4.5% weekly move demonstrates directional conviction when catalysts align
Upside & Downside
Primary risk: Breakdown below 28,850 critical support triggers acceleration toward 25,733 200-day MA or lower as June 17 FOMC hawkish repricing removing 2026 rate cut expectations combines with technical structure failure below 50-day MA and elevated 35.33x trailing P/E requiring multiple compression if higher-for-longer rates persist without Q2 earnings growth validation starting July (Probability: medium)
Primary opportunity: Hold above 28,850-29,300 support zone combined with VIX compression continuation below 18 and settling of June 22 rebalancing flows drives recovery toward 29,744-30,000 resistance as June 17 FOMC hawkish shock fully absorbs over 2-week window and AI capex structural support ($700B+) reasserts with Q2 earnings season approaching mid-July (Timeframe: 2-3 weeks as July 1 ISM Manufacturing provides economic trajectory clarity and July 29 FOMC offers next policy update, with historical 70% probability that post-rebalancing volatility settles within 7-10 trading days if no additional macro catalyst emerges)
This week's edge: Resetting after 4 consecutive MISSED graded calls (exceeding 3-miss threshold) - thesis under review per mandatory Rule 5 requirement for EQUITY_INDEX category
The Week Ahead
The ISM Manufacturing PMI for June 2026 released July 1 at 10:00 AM EDT, testing whether expansion momentum from May's 55.7 reading continues and whether pricing pressures persist, providing first major economic data point post-June 17 FOMC hawkish pivot on Wednesday 1 July represents a mid-tier catalyst that could accelerate or stall the current directional thesis.
How Nasdaq 100 navigates the confluence of consolidating conditions and incoming data will determine whether the current directional thesis holds or breaks.
This analysis covers one dimension. Our full weekly report combines six specialist agents into a single actionable briefing with directional bias, key levels, and risk-opportunity matrix.
Start Free — Get the Market of the WeekFree weekly report · No credit card · Upgrade anytime



