Nasdaq 100 COT & Institutional Positioning — Smart Money Analysis
Nasdaq 100 institutional positioning: COT data, sentiment analysis and smart money flow assessment.

Where Institutions Stand
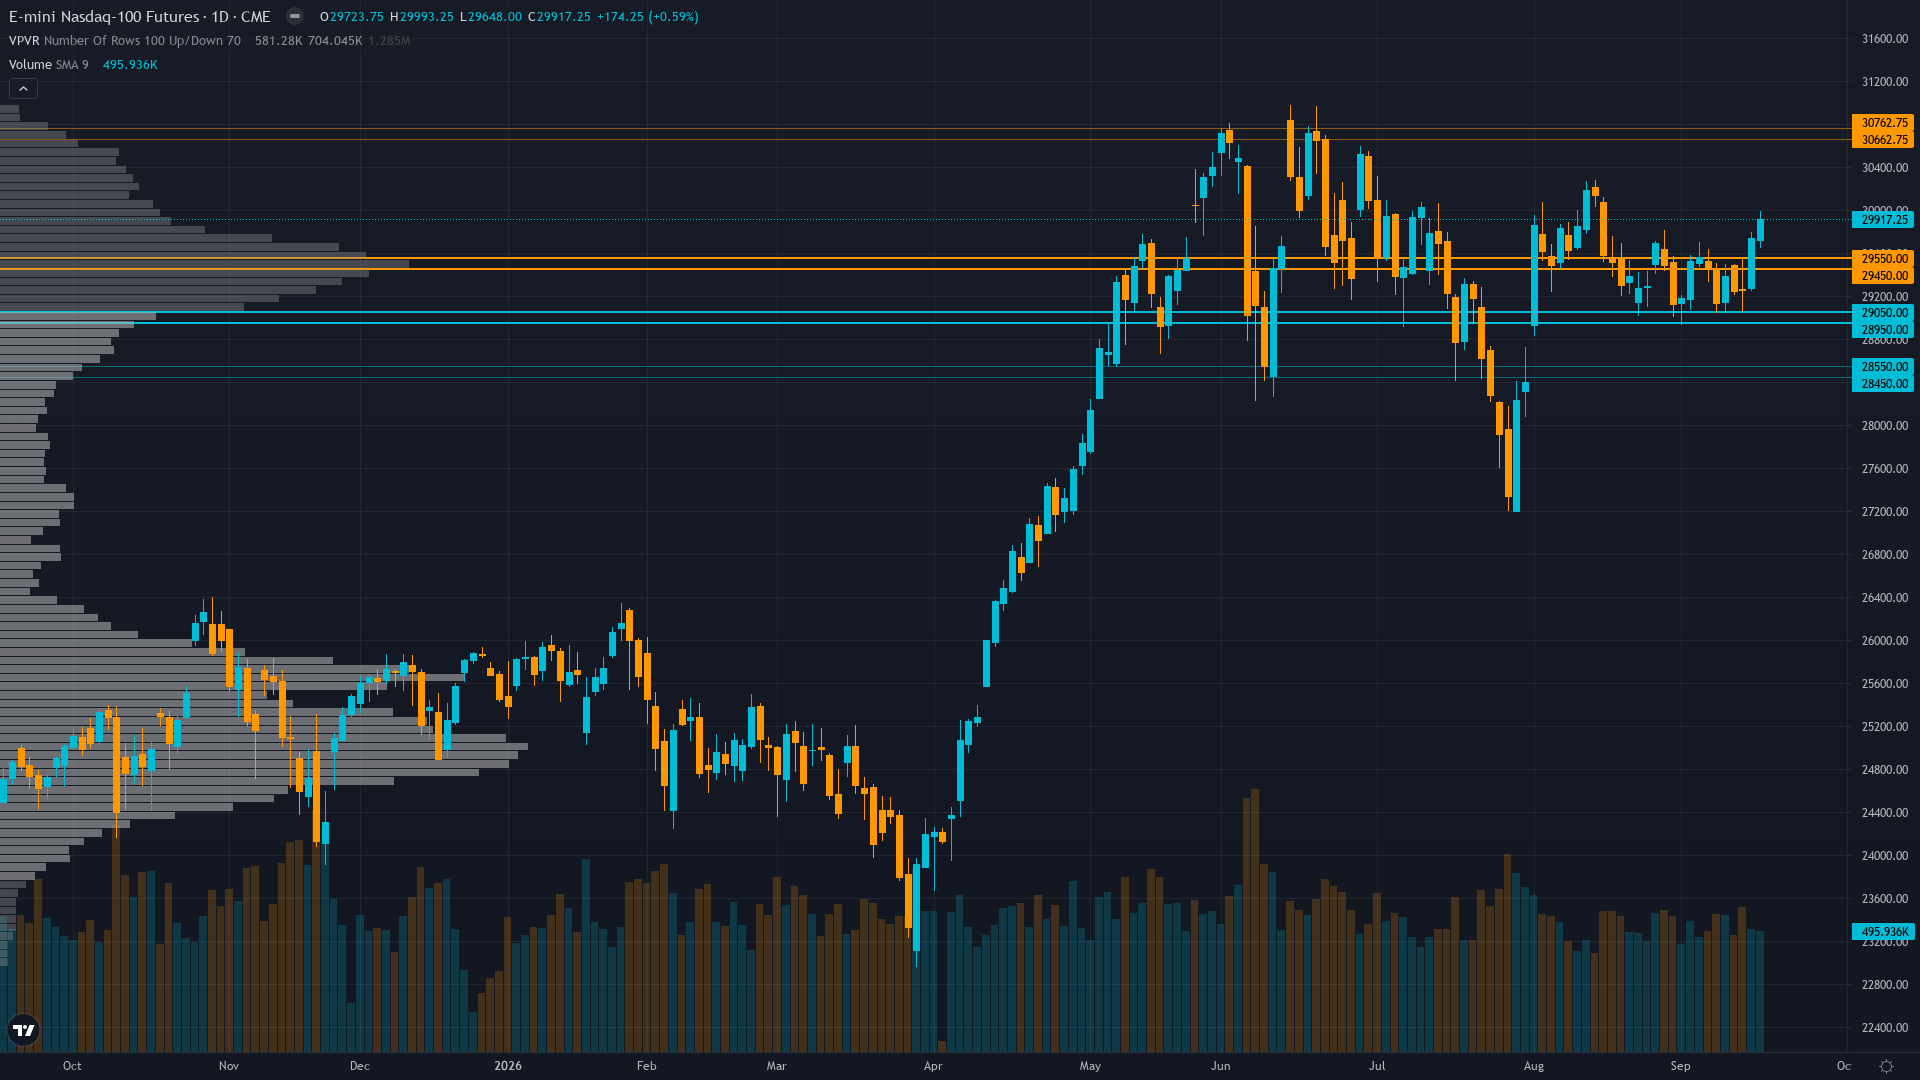
Nasdaq 100 sits at 29613.68 after slipping 0.17% — a shallow pullback rather than a decisive move.
Strongly constructive with accelerating momentum — non-commercial net longs surged +12,823 contracts (+61% weekly) to +33,718 at 83.5th percentile of 3-year range, confirming trend-following speculative accumulation as commercial hedgers increase shorts to -48,858 reflecting institutional hedging at elevated levels; quarter-end window dressing approaching Sep 30 provides additional mechanical support for quality growth names
Consensus vs MAD View
Market consensus: Cautiously constructive with consensus acknowledging the stark retail-institutional divergence and stable macro backdrop while remaining tactical given 10Y yield above 5%, September seasonal headwinds, and the approaching Sep 23 PMI data as the next directional catalyst; most participants are positioned for range-bound continuation rather than directional breakout
Primary driver: Institutional positioning surge with CFTC COT data from Sep 15 showing non-commercial net longs increased +12,823 contracts (+61% weekly) to +33,718 at the 83.5th percentile of the 3-year range, representing accelerating trend-following accumulation that confirms institutional conviction in the AI-driven earnings cycle as Q3 2026 earnings season approaches in October
Where the Crowd May Be Wrong
The desk identifies a material gap between extreme retail bearish sentiment (-24.5% AAII spread at capitulation levels, Fear & Greed 29) and accelerating institutional accumulation (COT +61% weekly to 83.5th percentile), combined with an AI capex cycle approaching $800B that is structurally supportive but appears underweighted by a consensus focused on September seasonal anxiety and a 5% 10Y yield that is already priced into below-average forward P/E multiples
Crowd Psychology
Neither side has committed heavily to Nasdaq 100 futures, leaving sentiment in a neutral zone that offers little directional guidance on its own.
Options Flow
NQ implied volatility at 18.46% moderately elevated compared to 20-day realized vol of 12.8% suggesting event premium pricing for upcoming PMI data and Fed speeches; CBOE total put/call ratio at 0.95 with 9-day average of 0.85 (38th percentile) indicating neutral-to-slightly-complacent options sentiment; VXN at ~22.72 with VIX at 14.81, showing compressed tech-specific volatility premium consistent with the consolidation regime
The Bottom Line on Positioning
The positioning mosaic for tech futures combines fear sentiment with contracting volatility conditions. Trend strength sits at 5/10, reflecting moderate directional pressure without clear dominance. Taken together, institutional behaviour, crowd psychology, and derivatives data frame the setup heading into the new week.
This analysis covers one dimension. Our full weekly report combines six specialist agents into a single actionable briefing with directional bias, key levels, and risk-opportunity matrix.
Start Free — Get the Market of the WeekFree weekly report · No credit card · Upgrade anytime


