Nasdaq 100 COT & Institutional Positioning — Smart Money Analysis
Nasdaq 100 institutional positioning: COT data, sentiment analysis and smart money flow assessment.

Where Institutions Stand
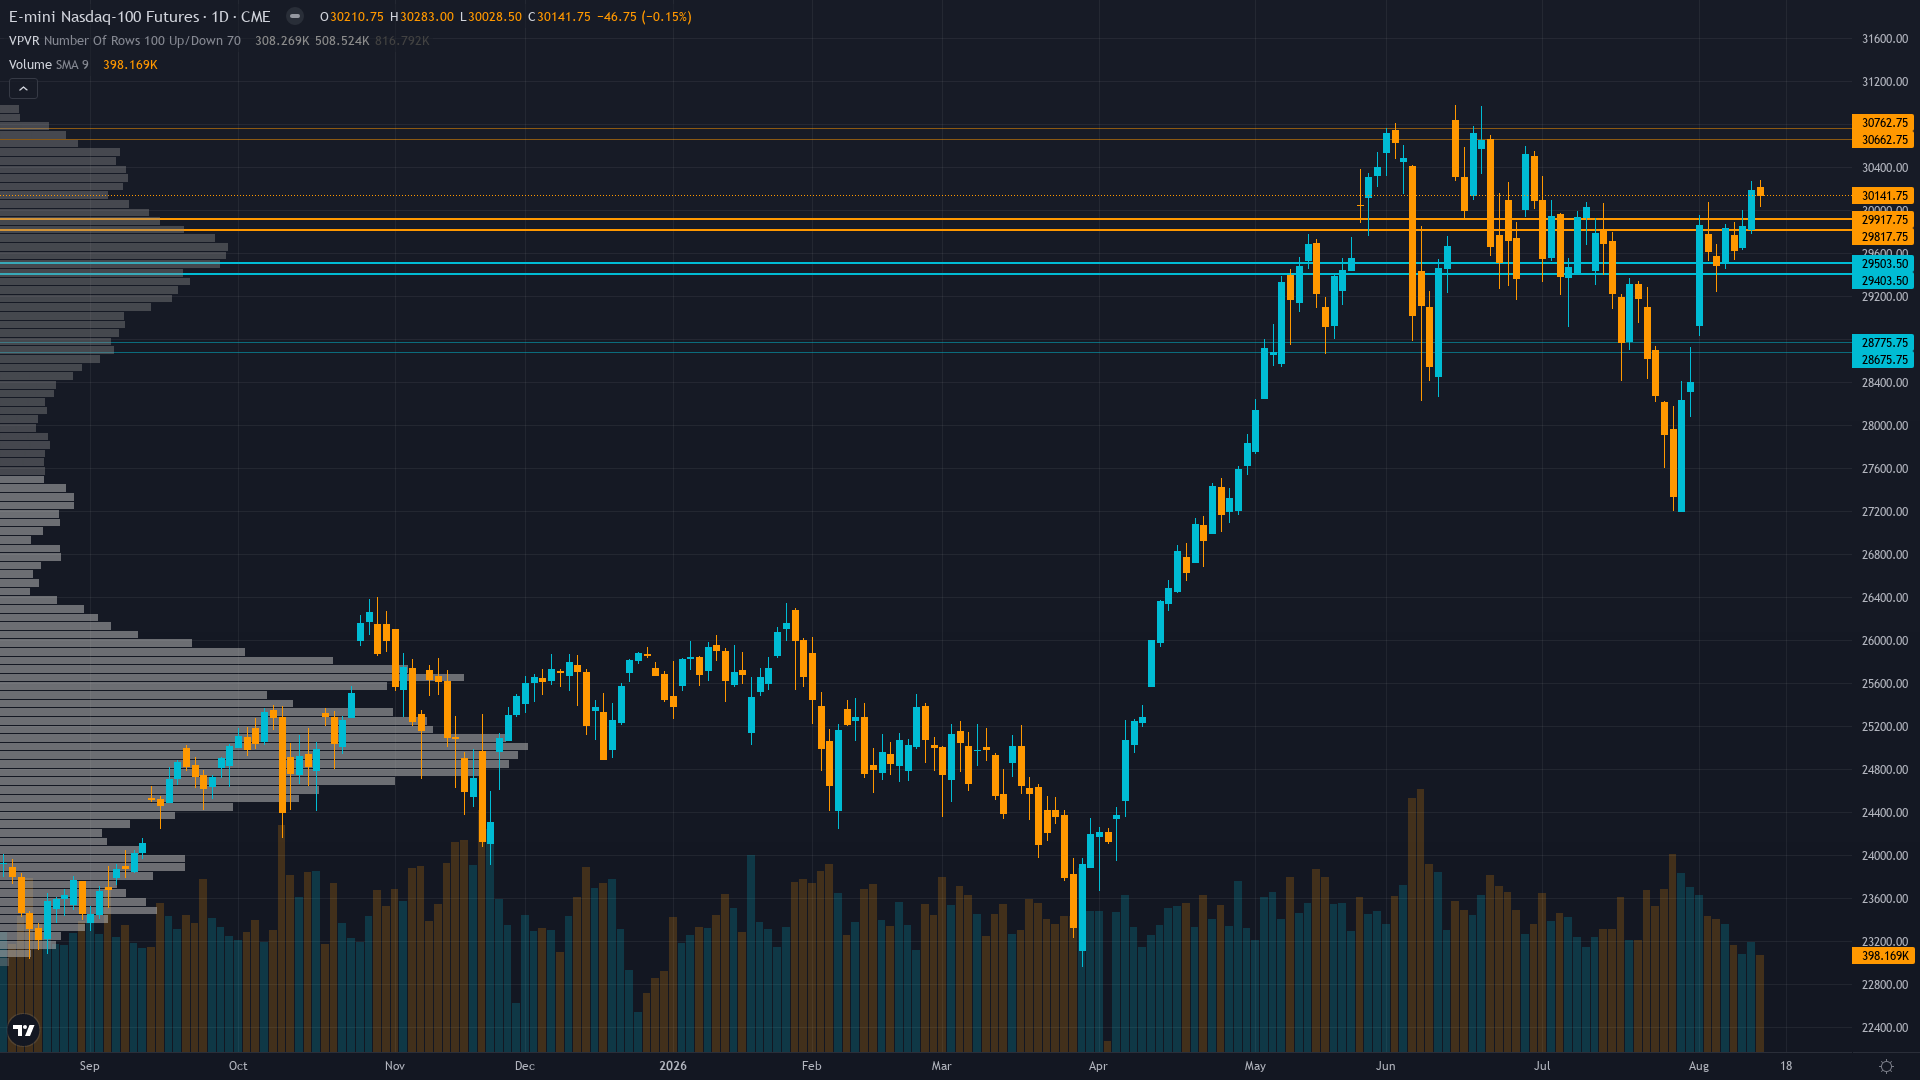
Nasdaq 100 is trading at 30141.75, down 0.15% in a measured pullback.
Extreme contrarian setup - non-commercials net short -39,302 contracts at 0th percentile of 3-year range (record bearish), with -24,663 contraction week-over-week; $2.2B positive gamma from dealer long positioning provides structural stability while speculative shorts are acutely vulnerable to squeeze above 30,283 resistance
Consensus vs MAD View
Market consensus: Broadly constructive with consensus acknowledging stable macro (contained CPI, Fed on hold) and AI-driven earnings momentum supporting tech, while noting record COT short positioning creates binary squeeze risk and VIX complacency leaves market exposed to sentiment shocks
Primary driver: COT extreme short positioning at 0th percentile (-39,302 contracts, -13.9% of OI) creating powerful contrarian squeeze setup against a RISK-ON macro regime, but discipline signals are too mixed to produce directional conviction above the 1.0 Min Signal threshold
Where the Crowd May Be Wrong
Desk sees extreme COT short positioning at 0th percentile (-39,302 contracts, record bearish) combined with a -8.1 vol risk premium (IV 14.9% vs realized 23%) as creating asymmetric squeeze potential that consensus acknowledges but positioning data shows is not being hedged for; however, signal below Min Signal threshold keeps desk at NO CALL, and Sentiment's greed reading (F&G 65) aligns with the crowd's prevailing optimism, limiting overall divergence to mild-moderate range
Crowd Psychology
Neither side has committed heavily to Nasdaq 100 futures, leaving sentiment in a neutral zone that offers little directional guidance on its own.
Options Flow
NQ ATM IV at 14.9% significantly below 20-day realized vol of 23% creating negative vol risk premium; VIX at 14.55-14.63 near multi-year lows; $2.2B positive gamma indicates dealers long gamma dampening volatility and supporting range-bound trading; cheap options price upside optionality for squeeze event
The Bottom Line on Positioning
The positioning mosaic for tech futures combines greed sentiment with contracting volatility conditions. Trend strength registers at 6/10, suggesting meaningful but not extreme directional bias. Taken together, institutional behaviour, crowd psychology, and derivatives data frame the setup heading into the new week.
This analysis covers one dimension. Our full weekly report combines six specialist agents into a single actionable briefing with directional bias, key levels, and risk-opportunity matrix.
Start Free — Get the Market of the WeekFree weekly report · No credit card · Upgrade anytime



