Nasdaq 100 COT & Institutional Positioning — Smart Money Analysis
Nasdaq 100 institutional positioning: COT data, sentiment analysis and smart money flow assessment.

Where Institutions Stand
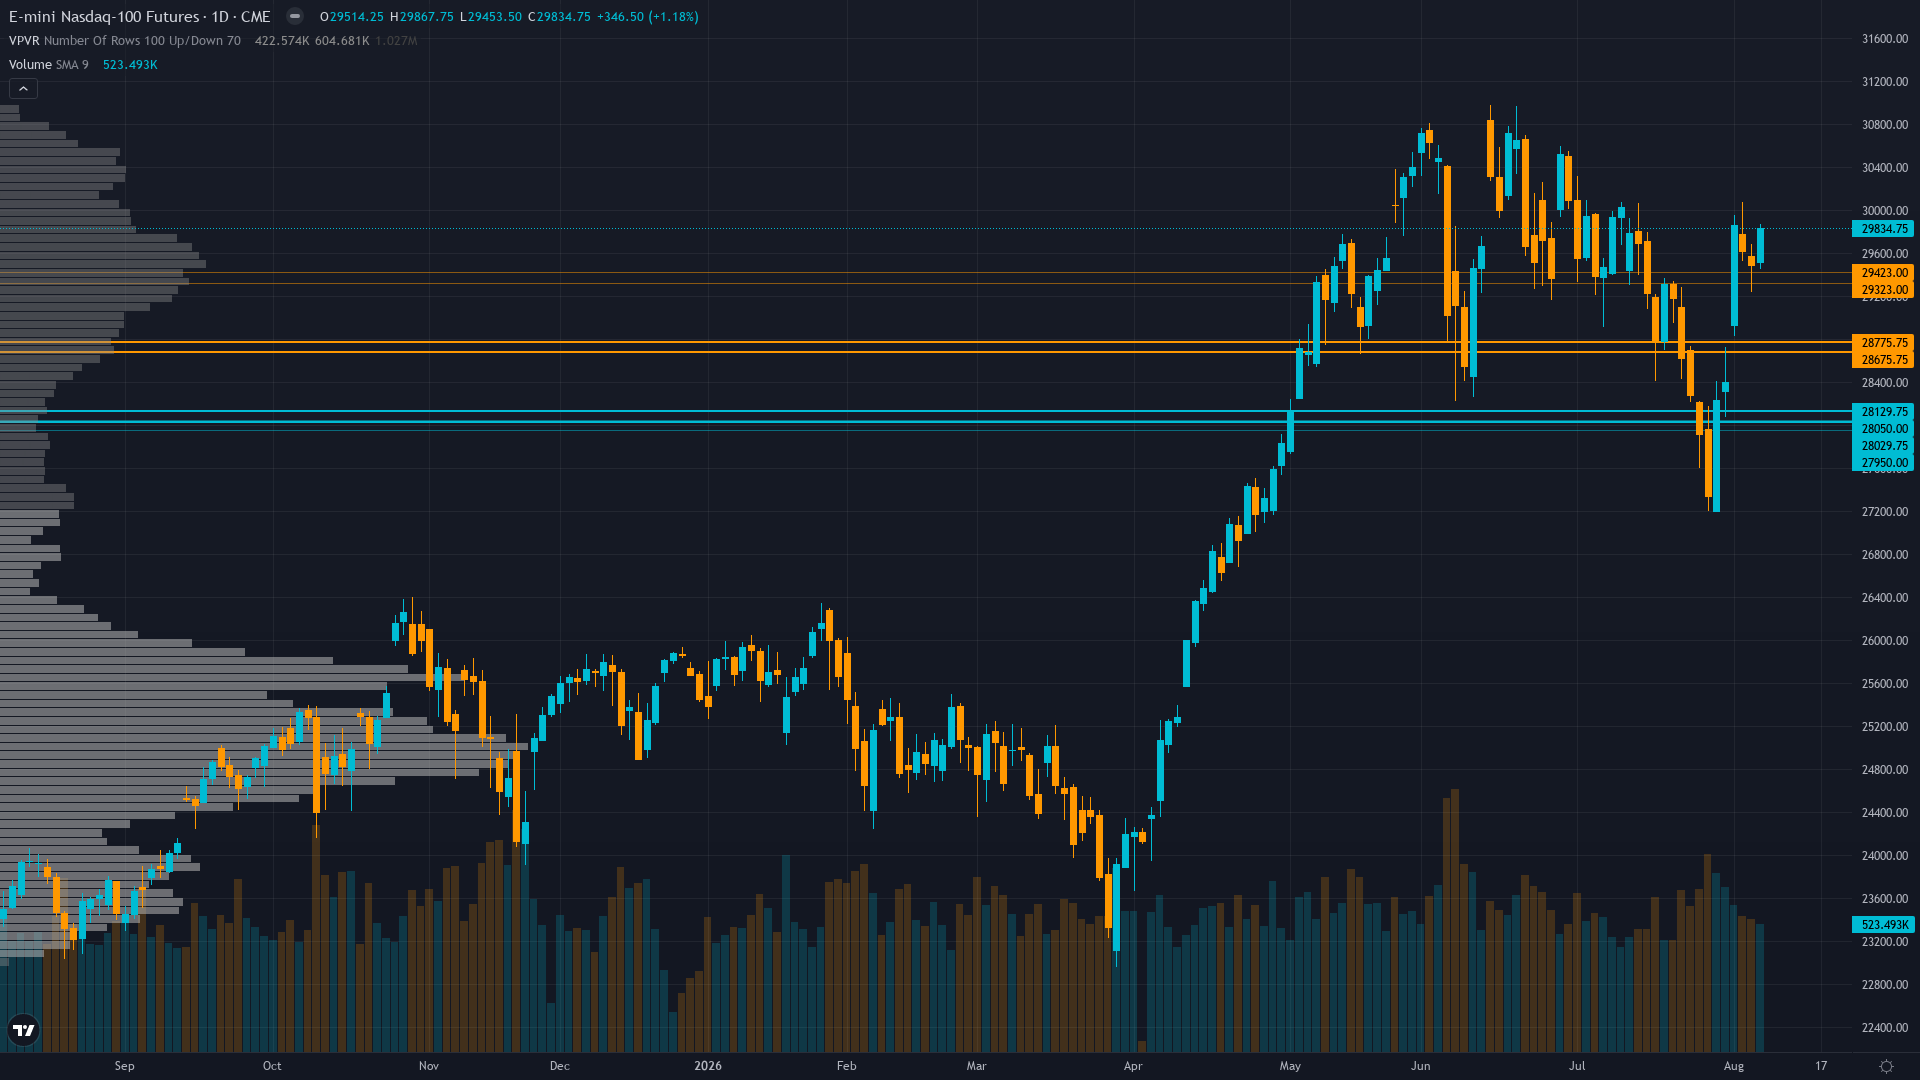
Nasdaq 100 is trading at 29834.75, up 1.18% in the last 24 hours as buyers maintain control.
Extreme contrarian bullish - non-commercials net short -14,639 contracts at 1.3rd percentile (3-year low) while price rallies +5.0% weekly; $7.85B QQQ ETF inflows create divergence between futures and cash positioning, with short squeeze risk elevated
Consensus vs MAD View
Market consensus: Broadly bullish after best weekly performance since April 2026 with S&P 500 at record close, driven by AI earnings validation and NFP miss reinforcing Fed patience, though August 12 CPI represents binary risk and sentiment shows mix of greed (F&G 63) and lingering caution (AAII -11.1% bearish spread)
Primary driver: AI-driven tech rally with NQ +5.0% weekly, best since April 2026, as mega-cap earnings validate $725B AI capex cycle and August NFP miss (July payrolls -23K) reinforces Fed patience narrative, with S&P 500 closing at record high on August 7, 2026
Where the Crowd May Be Wrong
The desk sees extreme institutional short positioning (COT 1.3rd percentile, -14,639 contracts) and a -6.9 vol risk premium (IV 19.1% vs realized 25.3%) as materially underappreciated squeeze catalysts that the market is not pricing - speculative shorts are piling into bearish futures while the index rallies +5% weekly to near-record highs, creating asymmetric upside that consensus commentary acknowledges but positioning data shows is not being acted upon
Crowd Psychology
Neither side has committed heavily to Nasdaq 100 futures, leaving sentiment in a neutral zone that offers little directional guidance on its own.
Options Flow
NQ ATM IV at 19.1% well below 20-day realized vol of 25.3% creating -6.9 vol risk premium; VIX at 15.15 shows equity volatility complacency; positive gamma $979.6M with call wall at $31,000 and put wall at $28,000 provides dealer-driven stabilization; depressed vol pricing supports bull continuation
The Bottom Line on Positioning
The positioning mosaic for tech futures combines greed sentiment with contracting volatility conditions. Trend strength registers at 7/10, suggesting meaningful but not extreme directional bias. Taken together, institutional behaviour, crowd psychology, and derivatives data frame the setup heading into the new week.
This analysis covers one dimension. Our full weekly report combines six specialist agents into a single actionable briefing with directional bias, key levels, and risk-opportunity matrix.
Start Free — Get the Market of the WeekFree weekly report · No credit card · Upgrade anytime



