Nasdaq 100 COT & Institutional Positioning — Smart Money Analysis
Nasdaq 100 institutional positioning: COT data, sentiment analysis and smart money flow assessment.

Smart Money Positioning
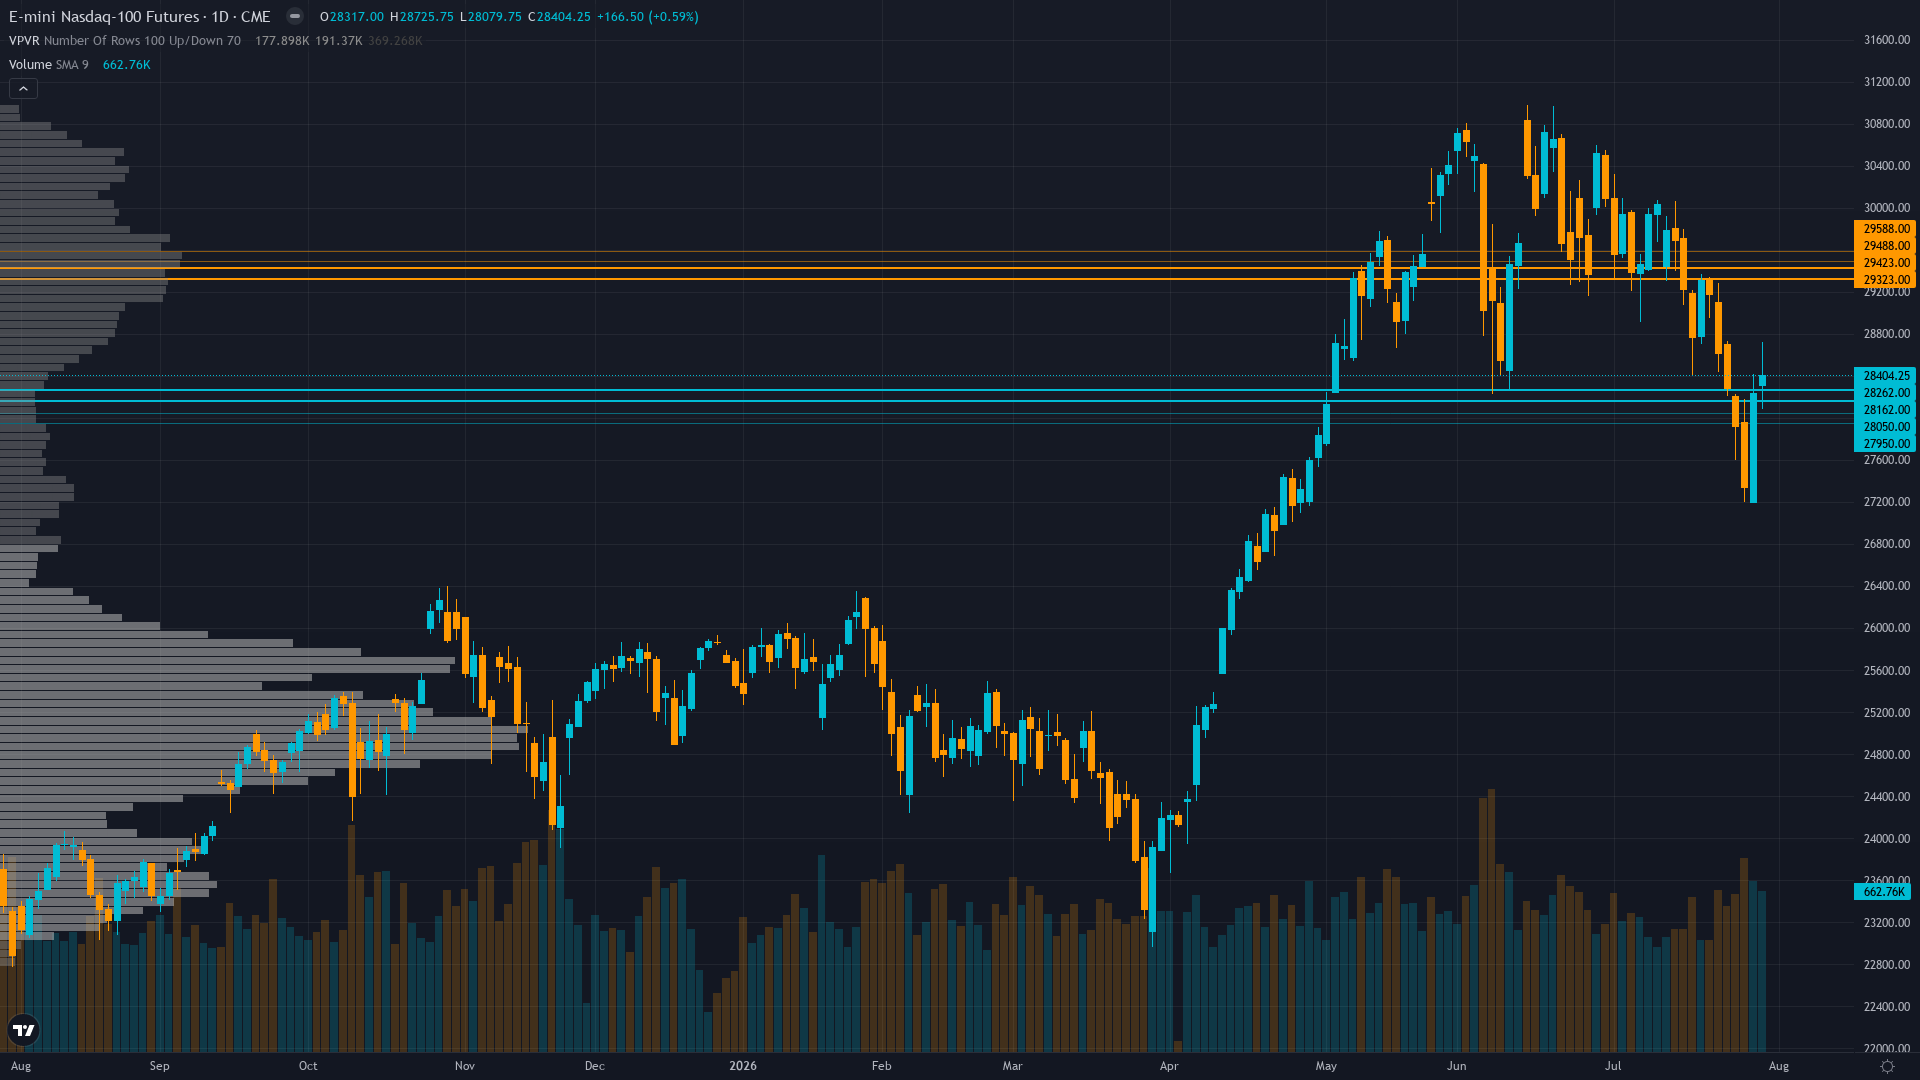
At 28404.25, Nasdaq 100 has inched 0.59% higher in a measured advance.
Neutral-to-defensive with open interest at 287.41K declining from prior weeks indicating position unwinding, technical rating showing 'Sell' across multiple platforms, no extreme positioning signals but post-FOMC uncertainty keeping institutional flows defensive
Consensus Check
Market consensus: Cautiously defensive post-FOMC with consensus acknowledging the 9-3 divided vote and market repricing to two 2026 hikes as structurally hawkish for tech, while noting 47.4% Q2 earnings growth provides fundamental support but is insufficient to overcome rate headwind in current environment
Primary driver: July 28-29 FOMC 9-3 hold decision (4 days ago) with three dissents favoring hike has shifted market pricing to two 25bp rate hikes in 2026, with Bloomberg confirming Nasdaq 100 entered correction territory post-decision as VIX crossed above 20 for the first time since June 5, creating a structurally hawkish backdrop that compresses tech multiples
Divergence Assessment
Low divergence as the desk's NO CALL position aligns with consensus uncertainty post-FOMC, with both desk and market recognizing the competing forces of strong Q2 earnings (47.4% growth) versus structurally hawkish Fed repricing (two 2026 hikes), and no single factor dominating enough to create directional conviction; no blindspot identified as FOMC outcome, earnings results, and technical structure are all well-understood by market participants
Market Sentiment
The sentiment picture for Nasdaq 100 futures is evenly split, providing no contrarian signal in either direction. The next move will likely be event-driven.
What Options Markets Show
VIX at 20.66 crossed above 20 threshold signaling elevated volatility regime, VXN at 28.61 showing tech-specific stress, NQ IV at 24.91% for September options moderately elevated, put/call ratio data insufficient but low complacency signals from prior weeks likely have been disrupted by post-FOMC volatility expansion
Positioning Summary
Putting the positioning picture together for Nasdaq futures: sentiment is fear, trend strength registers just 3/10, which typically corresponds to choppy, directionless price action. The net assessment from institutional data, crowd positioning, and derivatives activity points to a market where the balance of forces tilts in a discernible direction.
This analysis covers one dimension. Our full weekly report combines six specialist agents into a single actionable briefing with directional bias, key levels, and risk-opportunity matrix.
Start Free — Get the Market of the WeekFree weekly report · No credit card · Upgrade anytime



