Gold Forecast This Week — Outlook, Drivers & Key Levels
This week's Gold outlook: key drivers, volatility context, risk-opportunity assessment and the week ahead.

Market Overview
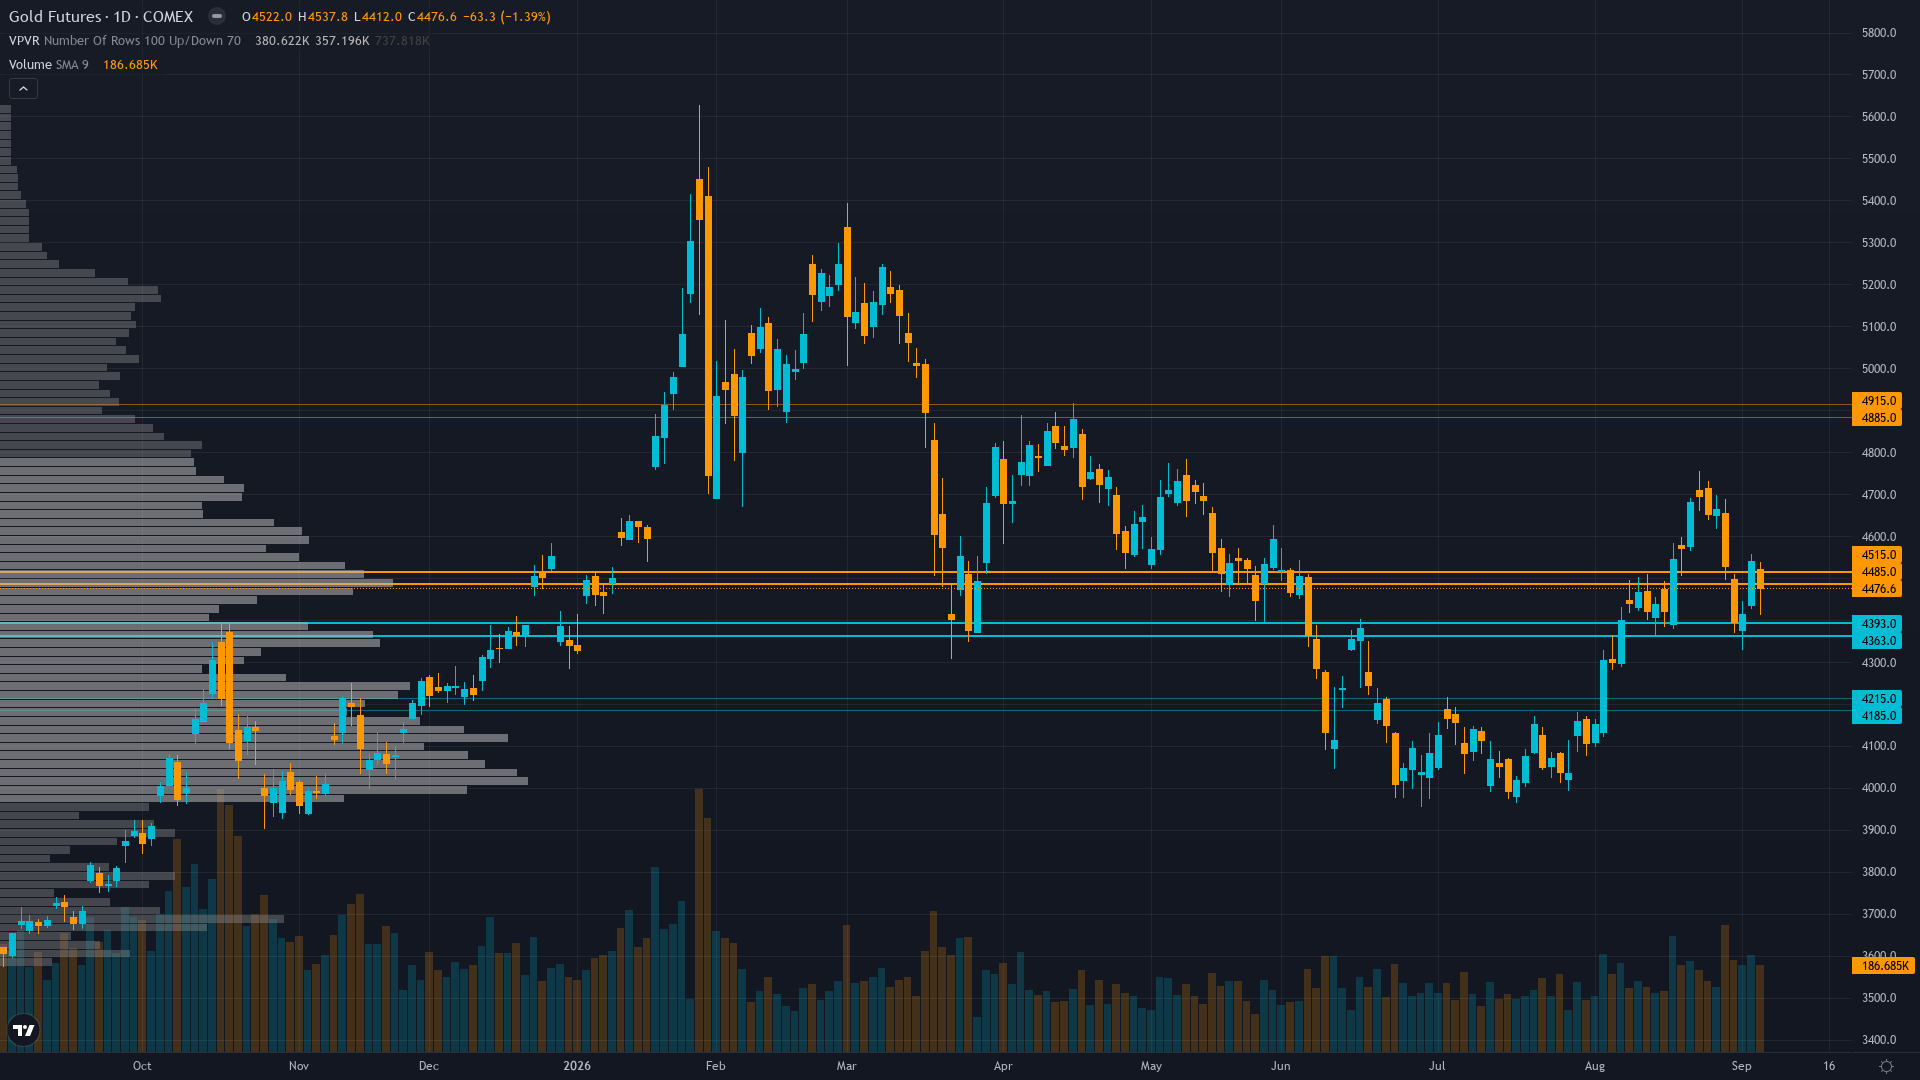
Trading at 4429.8 with a 0.72% dip, gold is giving back ground gradually. gold futures is range-bound and tightening, with decreasing volatility signalling a directional resolution ahead.
Cautiously bullish with near-term consolidation; gold is stabilizing after the Aug pullback with analysts split on whether $4,300-$4,700 range resolves higher toward $4,800-$5,000 on September seasonal strength and dovish Fed rhetoric or remains range-bound awaiting the PPI/CPI catalyst next week
This Week's Catalysts & Drivers
Primary driver: Gold consolidating near $4,430 after a flat week (+0.02%) following the Aug 26-Sept 4 pullback from $4,624, stabilizing above $4,378-$4,415 support as the structural bull thesis from central bank buying and real yield compression remains intact but near-term momentum has faded
Secondary factor: Fed bifurcation: Governor Waller's dovish Sep 3 remarks advocating steady rates trimmed September rate-hike odds toward 50%, supporting gold's rate-cut narrative, but the resilient August jobs data on Sep 4 rekindled hike bets, creating a policy tug-of-war that has gold pinned in consolidation
Additional influence: CFTC COT data as of Sep 1 shows non-commercial net longs declined -15,210 contracts to 228,124 (54.9% of OI, 60.8th 3-year percentile) — specs trimmed longs during the pullback, removing some of the bullish divergence edge but also reducing the crowded-long risk that had been building
Economic backdrop: DXY at 99.16 reflecting ongoing USD weakness but stabilizing; Fed funds rate 3.63% with policy direction unresolved; VIX at 16.34 in neutral territory; key catalysts ahead: PPI (Sep 10, est +0.3% MoM), CPI (Sep 11), and existing home sales (Sep 10) — a soft inflation print could re-energize the rate-cut narrative
Fundamental assessment: Gold appears 4-8% undervalued at $4,430 vs real yield model fair value of $4,600-$4,800; Q2 2026 central bank buying at 289t (strongest Q2 on record) provides structural demand floor; Grasberg mine supply constraints persist; the fundamental case remains intact but requires lower conviction without a fresh catalyst
Technical Picture
Price at $4,430 consolidating after breaking below the 50-day MA ($4,730) three weeks ago and holding above the 200-day MA ($4,340); RSI near 56 in neutral territory, Stochastic exiting oversold suggesting early recovery potential; critical near-term support at $4,378-$4,415 zone tested and held
At 5/10, trend strength is middling — enough to suggest a lean, but not enough to trade with high confidence.
Bull & Bear Case
Primary risk: Stronger-than-expected PPI (Sep 10) or CPI (Sep 11) prints triggering hawkish Fed repricing and a surge in real yields above 2.5%, breaking gold below $4,378-$4,415 support and accelerating selling toward $4,200 as speculative long liquidation from the 60.8th percentile COT positioning compounds the technical damage (Probability: medium)
Primary opportunity: Soft PPI/CPI prints next week confirming the disinflation trend, combined with the September seasonal tailwind (+2.1% average, 64% positive years) and Indian festival demand building toward Diwali, catalyzing a recovery above $4,500 resistance toward $4,600-$4,855 within 2-4 weeks as the structural bull case reasserts (Timeframe: Next 2-4 weeks through the PPI/CPI release window (Sep 10-11), with September seasonal tailwind providing multi-week structural support and Indian festival season (Dhanteras/Diwali) building physical demand through October)
This week's edge: The market may be underestimating the improvement in risk-reward from the COT position reduction — speculative longs declined from the 72.8th percentile (Aug 25) to 60.8th percentile (Sep 1), reducing crowded-positioning vulnerability by 12 percentile points while price held support above $4,378; combined with the September seasonal tailwind (+2.1% average, 64% positive) and moderate 6/10 conviction reflecting thesis health adjustments from the single contrary week, the consolidation near $4,430 represents a base-building phase rather than a distribution top, though the PPI/CPI catalyst next week is needed to confirm the next leg higher
Volatility Regime
Volatility for gold price is at the 65th percentile over 90 days — a normal regime that allows for standard position sizing and conventional trade management. The vol trend is down, with contraction across timeframes creating the kind of coiled conditions that historically resolve explosively.
Normal volatility at 65th percentile supports 1.5-2.0% daily ranges consistent with consolidation — the $4,378-$4,415 support zone and $4,500 resistance provide actionable levels for breakout confirmation with reasonable reliability; false signal risk is moderate as the market awaits the PPI/CPI binary event
What to Watch
The Producer Price Index MoM (Aug) — High impact; consensus +0.3% vs prior 0.0%; a miss below expectations would reinforce disinflation narrative and support gold via the rate-cut channel; a hot print above 0.3% would strengthen the hawkish case and pressure gold through real yields on Thursday 10 September stands as the week's primary risk event — high-impact and capable of overriding the existing technical and sentiment setup.
The interplay between consolidating market conditions and upcoming catalysts will define this week's trading landscape for COMEX gold.
This analysis covers one dimension. Our full weekly report combines six specialist agents into a single actionable briefing with directional bias, key levels, and risk-opportunity matrix.
Start Free — Get the Market of the WeekFree weekly report · No credit card · Upgrade anytime



