Gold Forecast This Week — Outlook, Drivers & Key Levels
This week's Gold outlook: key drivers, volatility context, risk-opportunity assessment and the week ahead.

Market Overview
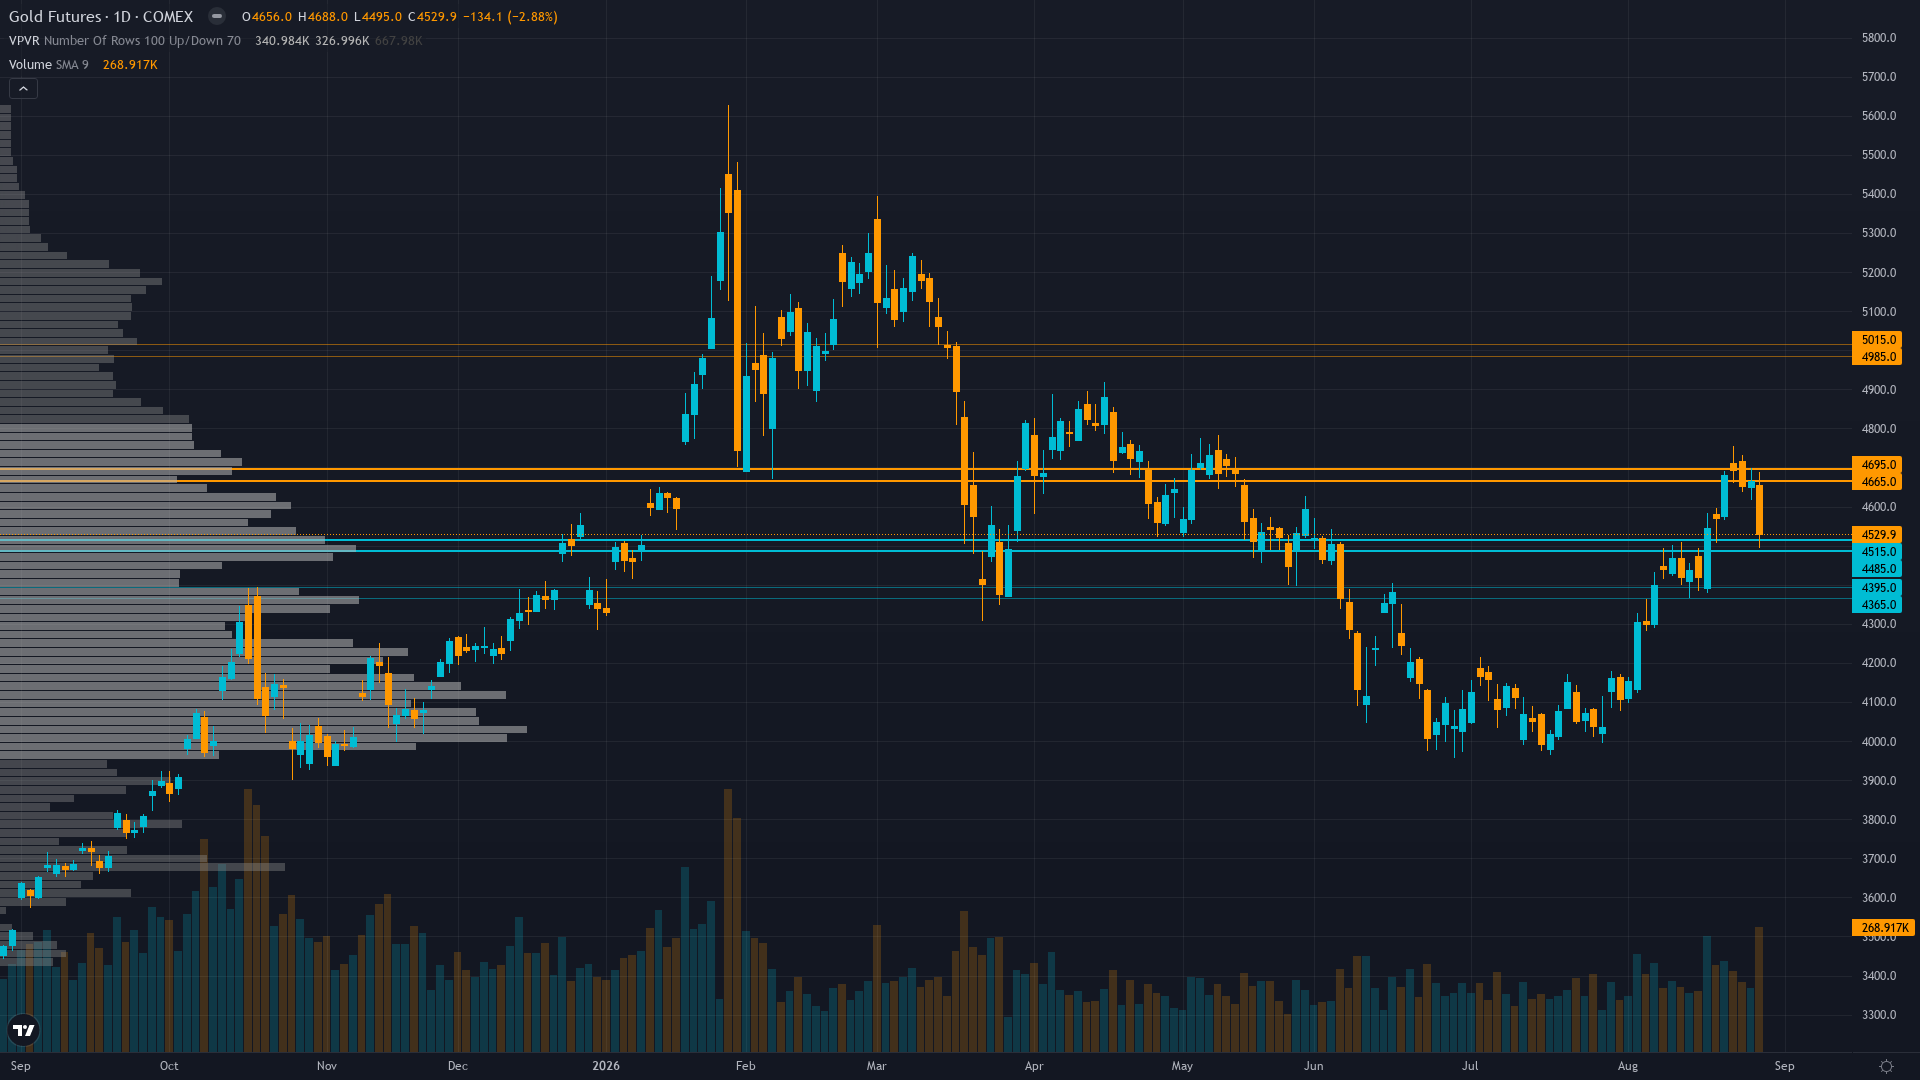
At 4478.1, gold has eased 0.72% in a controlled retreat. gold futures is range-bound and tightening, with decreasing volatility signalling a directional resolution ahead.
Bullish on gold with near-term caution after the -3.16% weekly pullback, with consensus viewing the correction as a buying opportunity within an intact structural uptrend driven by USD weakness, rate-cut expectations, and record central bank buying
This Week's Catalysts & Drivers
Primary driver: Gold consolidating after a -3.16% weekly pullback from $4,624 to $4,478, correcting from overbought levels following three consecutive bullish weeks (+15.8% cumulative), while the structural bull case remains intact with central bank buying at record levels and USD weakness supporting the macro backdrop
Secondary factor: CFTC COT data as of Aug 25 shows non-commercial net longs surged +21,145 contracts to 243,334 (56.9% of OI, 72.8th 3-year percentile) — specs added to longs during the pullback, creating a bullish divergence between positioning and price that suggests dip-buying rather than distribution
Additional influence: September seasonal tailwind begins this week (historically gold's strongest month at +2.1% average, positive 64% of years) driven by Indian festival season demand, providing a multi-week structural tailwind that aligns with the broader bullish thesis
Economic backdrop: VIX at 14.43 (Aug 28) well below 20 indicating RISK-ON regime; DXY near 99.13 reflecting ongoing USD weakness; Fed on hold at 3.63% with inflation at 2.31%; upcoming catalysts include ISM Manufacturing PMI (Sept 1, est 55.3), JOLTs (Sept 1, est 7.39M), ADP Employment (Sept 2, est 47K), and Beige Book (Sept 2)
Fundamental assessment: Gold appears 3-7% undervalued at $4,478 vs real yield model fair value of $4,600-$4,800; Q2 2026 central bank buying of 289 tonnes was the strongest Q2 on record; mine production faces supply constraints; structural deficit persists supporting the medium-term bullish thesis
Technical Picture
Price at $4,478 pulled back -3.16% for the week, breaking below the 50-day MA ($4,730) but holding above the 200-day MA ($4,340) and the $4,378-$4,415 support zone; RSI normalizing from overbought; the trend remains intact above the 200-day MA with +9.22% monthly gain still in place
At 6/10, trend strength indicates a solid directional lean without being overextended.
Bull & Bear Case
Primary risk: Continued breakdown below the $4,378-$4,415 support zone could accelerate selling toward $4,200 major support as technical damage to the 50-day MA triggers systematic trend-following liquidation, compounded by the crowded long positioning at the 72.8th percentile of COT history (Probability: medium)
Primary opportunity: Pullback holding above $4,378 support and resuming the uptrend as September seasonal tailwind (+2.1% average, 64% positive) combines with ongoing USD weakness, record central bank buying, and COT data showing specs adding on the dip — targeting a retest of $4,600-$4,900 within 2-4 weeks (Timeframe: Next 2-4 weeks as September seasonal strength window opens (historically strongest month), with the ISM/ADP/JOLTs data week providing the next macro catalyst, and Indian festival season demand (Diwali/Dhanteras) building through October)
This week's edge: The market may be underestimating the significance of COT data showing specs added +21,145 contracts (to 243,334) during a week when gold fell -3.16% — this bullish divergence between accumulation and price suggests the pullback is being absorbed by informed capital, not distributed. Combined with September's strongest seasonal month (+2.1% average) beginning tomorrow, the pullback from $4,624 to $4,478 may represent the dip that extends the trend rather than the reversal that ends it. However, conviction is capped at 5 due to the missed call and technical damage below the 50-day MA requiring confirmation of support before re-engaging at higher conviction levels.
Volatility Regime
Volatility for gold price is at the 65th percentile over 90 days — a normal regime that allows for standard position sizing and conventional trade management. The vol trend is down, with contraction across timeframes creating the kind of coiled conditions that historically resolve explosively.
Normal volatility at 65th percentile supports 1.5-2.0% daily ranges consistent with trending market conditions — $4,378-$4,415 support zone and $4,500 resistance provide actionable levels for breakout confirmation with reasonable reliability; false signal risk is moderate as the market digests the first counter-trend week after three consecutive bullish weeks
What to Watch
The ISM Manufacturing PMI (Aug) — High impact; estimate 55.3 vs prior 55.6; a print above expectations would reinforce RISK-ON regime but could complicate gold's rate-cut narrative; a miss would strengthen the case for Fed easing and support gold on Tuesday 1 September stands as the week's primary risk event — high-impact and capable of overriding the existing technical and sentiment setup.
The interplay between consolidating market conditions and upcoming catalysts will define this week's trading landscape for COMEX gold.
This analysis covers one dimension. Our full weekly report combines six specialist agents into a single actionable briefing with directional bias, key levels, and risk-opportunity matrix.
Start Free — Get the Market of the WeekFree weekly report · No credit card · Upgrade anytime



