Gold Forecast This Week — Outlook, Drivers & Key Levels
This week's Gold outlook: key drivers, volatility context, risk-opportunity assessment and the week ahead.

Market Overview
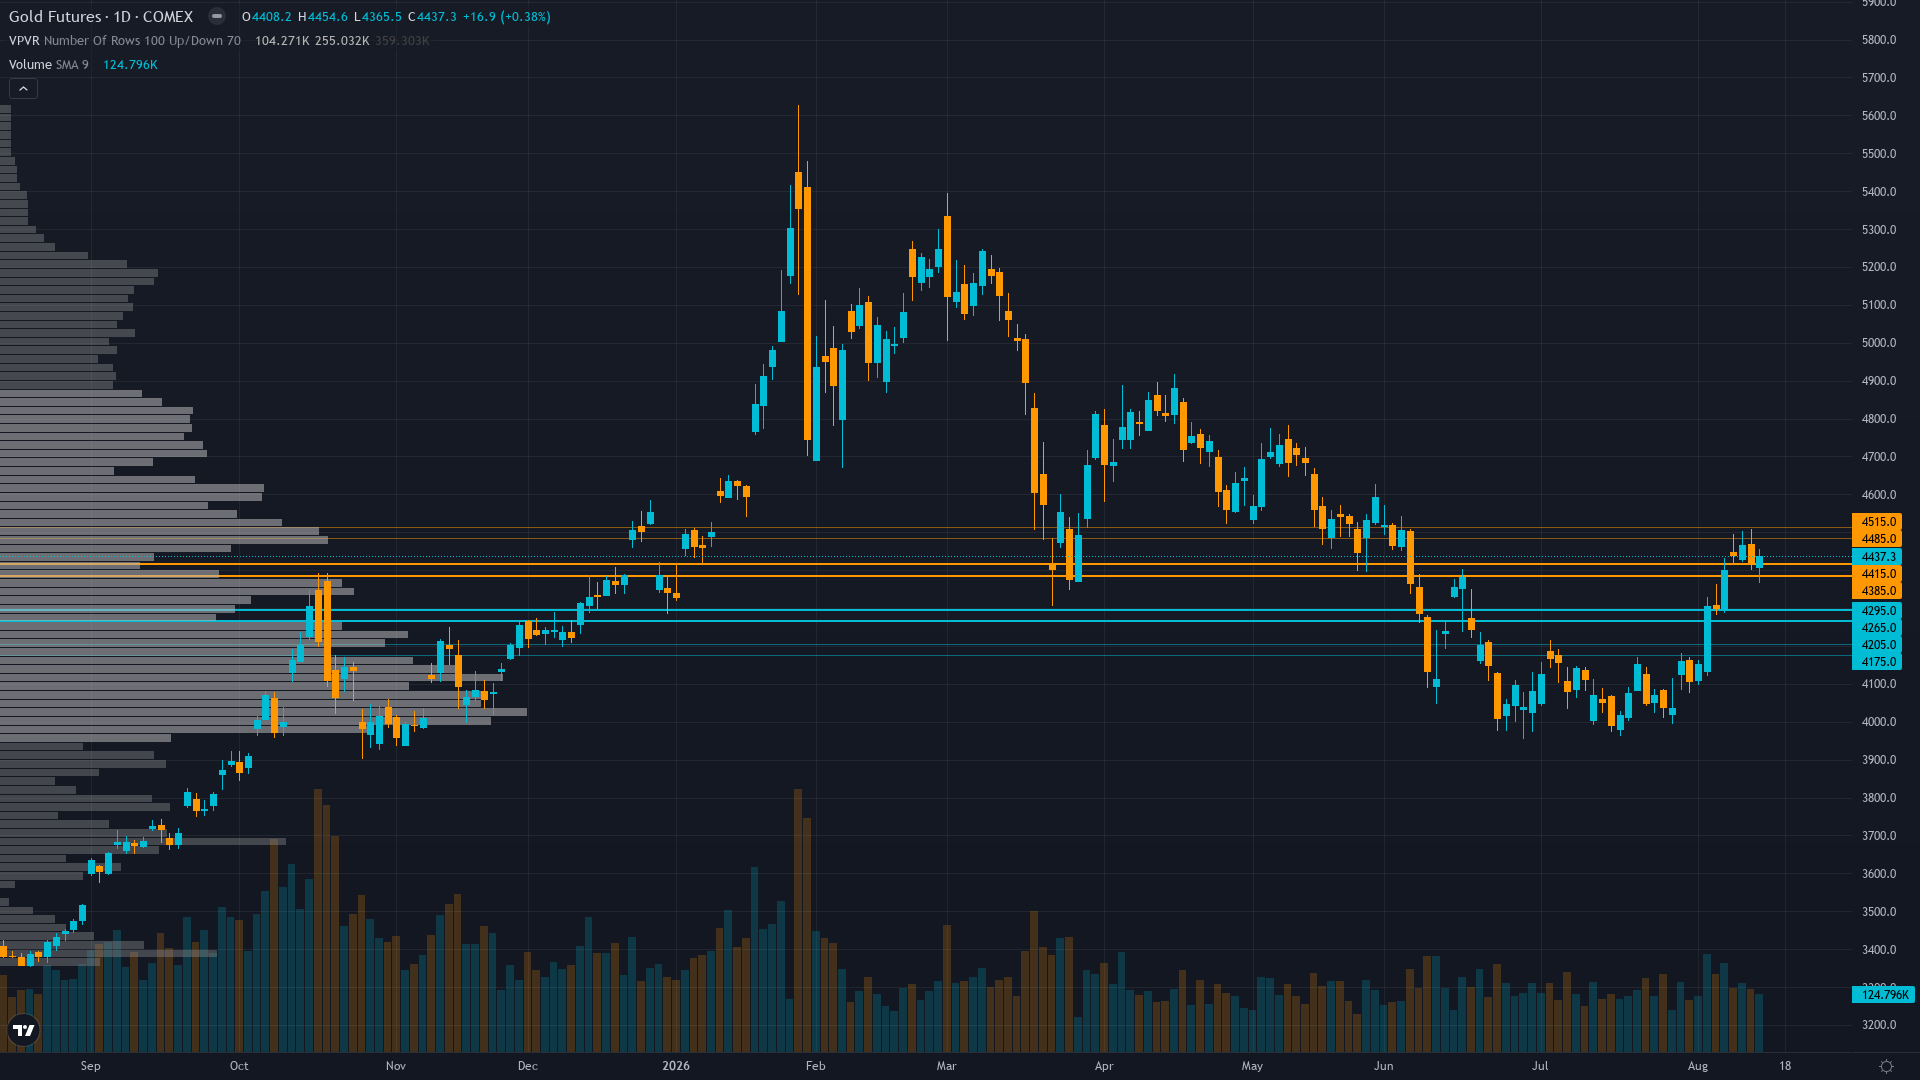
gold sits at 4380.4 after a 0.14% gain — a quiet move higher without aggressive momentum. gold futures remains in trend mode, where following the prevailing direction has been the path of least resistance.
Decisively bullish after July NFP shock and sustained breakout above $4,300, with consensus shifting from cautious consolidation to trend resumption as USD weakness, rate cut expectations, and central bank demand converge — COT at 59.5th percentile suggests room for further gains
This Week's Catalysts & Drivers
Primary driver: Macro regime shift toward rate cut expectations fueled by July NFP shock (Aug 7) showing first US payrolls decline in 5 years (-23K vs +80K expected), collapsing DXY to 99.6, and driving gold's +9.91% monthly rally as markets reprice Fed easing timeline
Secondary factor: CFTC COT data (Aug 11) shows non-commercial net longs surged +20,306 contracts to 217,940 (54.4% of OI) at only 59.5th 3-year percentile — bullish building substantially but still well below historical extremes, suggesting significant remaining capacity for speculative accumulation
Additional influence: Technical breakout sustained above $4,300-$4,400 resistance area with price trading above all key MAs for the first time since January breakdown, August seasonal tailwind (strongest month in Q3 per StoneX 25-year data), and China extending central bank gold buying to 21 consecutive months (Bloomberg Aug 7)
Economic backdrop: Transitional macro with dovish lean: Fed held at 3.63% (Jul), CPI at 2.27% trending above Fed target, DXY weakening to ~99.6, VIX 14.25 signaling calm equities while gold rallies on USD/rate narrative; July NFP shock (-23K) reshaping rate expectations; Housing Starts and IP data due Aug 18
Fundamental assessment: Moderately undervalued at ~17.6% below 52-week high of $5,318; structural demand supported by China's 21-month buying streak and constrained mine supply; real yields negative at ~2.27% inflation vs 4.68% 10Y nominal (2.41% real) but trajectory improving as rate cut expectations build
Technical Picture
Bullish trend sustained above $4,300 support with price at $4,380 riding all key MAs; RSI ~45-59 showing neutral-to-slightly-bullish momentum without overbought extremes; consolidating after breakout from $4,000-4,100 zone with next resistance at $4,400 round number then $4,510 prior swing high
At 8/10, trend strength signals that directional momentum is firmly in control.
Bull & Bear Case
Primary risk: July CPI on Aug 12 or upcoming housing/IP data surprises to the upside, rekindling stagflation fears or complicating the rate-cut narrative triggered by NFP weakness, causing profit-taking from overbought levels toward $4,200-4,300 support zone as real yields resist compression (Probability: medium)
Primary opportunity: Continuation of gold's trending move toward $4,500-4,700 within 2-4 weeks as rate-cut expectations solidify, USD continues declining (DXY toward 98), August-September seasonal tailwind (average +4-7% Aug-Oct, 65%+ success rate), and speculative positioning at only 59.5th percentile has room to expand toward historical extremes above 80th percentile (Timeframe: Next 2-4 weeks through Aug 18 housing/IP data, late-August Jackson Hole symposium, and into September as gold capitalizes on the macro regime shift from higher-for-longer to rate-cut-pricing, with August seasonal strength providing additional tailwind)
This week's edge: The market may be underestimating the remaining capacity for speculative positioning growth — COT non-commercial net longs at only 59.5th percentile of 3-year range despite surging +20,306 contracts, suggesting institutional flow has significant room to accelerate before reaching crowded levels (80th+ percentile) that typically precede reversals; combined with August seasonal tailwind (strongest Q3 month per StoneX 25-year data) and China's 21-month buying streak, the multi-week trend has structural momentum that near-term data noise is unlikely to derail
Volatility Regime
Volatility for gold price is at the 65th percentile over 90 days — a normal regime that allows for standard position sizing and conventional trade management. The vol trend is flat, with no meaningful shift across timeframes. Stable vol environments often lull traders before a regime change arrives.
Normal volatility at 65th percentile supports 1.5-2.0% daily ranges consistent with trending market conditions — $4,300-4,400 zone provides actionable support/resistance with reasonable breakout reliability; false signal risk reduced versus the elevated vol of 24-28% seen during June breakdown phase
What to Watch
The July Housing Starts (High impact) and Industrial Production data — critical for validating whether July NFP weakness reflects genuine economic softening (supporting rate cuts and gold) or one-month noise; consensus Housing Starts 1.35M vs prior 1.427M, IP +0.3% MoM on Tuesday 18 August stands as the week's primary risk event — high-impact and capable of overriding the existing technical and sentiment setup.
The interplay between trending market conditions and upcoming catalysts will define this week's trading landscape for COMEX gold.
This analysis covers one dimension. Our full weekly report combines six specialist agents into a single actionable briefing with directional bias, key levels, and risk-opportunity matrix.
Start Free — Get the Market of the WeekFree weekly report · No credit card · Upgrade anytime



