Gold Forecast This Week — Outlook, Drivers & Key Levels
This week's Gold outlook: key drivers, volatility context, risk-opportunity assessment and the week ahead.

This Week's Starting Point
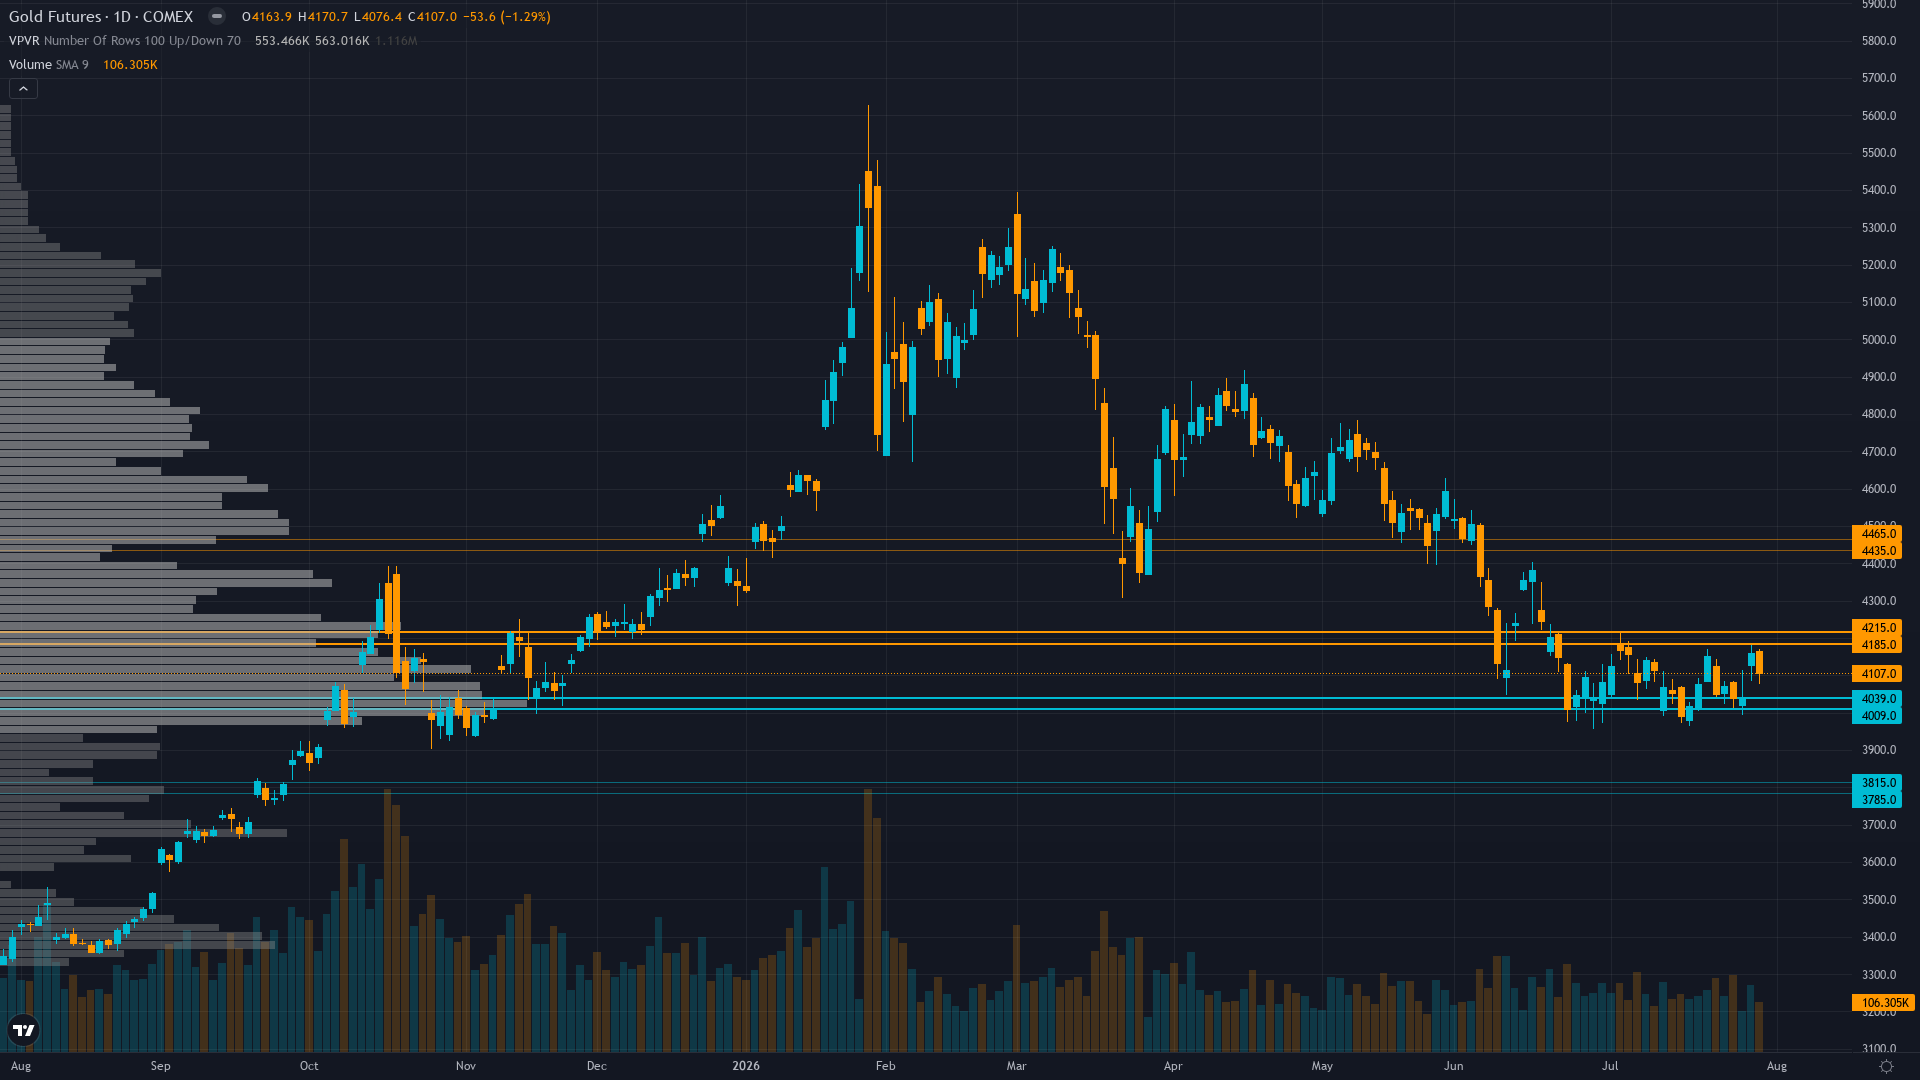
Trading at 4107 after a 1.29% slide, gold faces sustained selling interest. Price action in gold futures has compressed into a consolidation pattern, typically a precursor to a directional breakout.
Cautiously constructive after FOMC hold and record Q2 central bank buying data, with consensus shifting from bearish to neutral-to-mildly-bullish as gold posts first monthly gain in five months and enters historically strong August-September seasonal window
Forces in Play
Primary driver: July 29-30 FOMC hold (9-3 vote) provided modest tailwind as gold rallied to $4,104 weekly close, posting first monthly gain in 5 months (+0.29%) while 3 hawkish dissenters and Middle East geopolitical tensions create mixed forward signals as market enters August seasonal strength window
Secondary factor: Fundamental discipline upshift to BULLISH (+1 conf 6) on record Q2 2026 central bank buying at 289 tonnes (+74% YoY per World Gold Council July 30 report) providing structural demand floor, while J.P. Morgan maintains $6,000/oz year-end target suggesting 45% upside from $4,107 current levels creates valuation support tension with elevated real yield environment
Additional influence: Technical structure stabilizing above $4,070-$4,100 zone after 28% correction from January $5,626 ATH, with price consolidating above immediate $4,076 support and testing $4,115-$4,170 resistance, while RSI at 52 shows neutral momentum recovery from oversold conditions and August-September seasonal tailwind historically strongest period (+2.1% September average) begins
Economic backdrop: Fed held rates 3.50-3.75% on July 29 (9-3 vote, 3 dissenters favoring hikes), PCE eased to 3.7% YoY in June (from 4.1% in May), July CPI due August 12, VIX at 18.58 signaling neutral risk appetite, DXY providing mixed dollar backdrop with ongoing Middle East tensions (US airstrikes on Iranian targets) adding safe-haven premium
Fundamental assessment: Modestly undervalued versus structural drivers: record Q2 central bank buying 289t and J.P. Morgan $6,000 year-end target imply significant upside, but elevated real yields and continued ETF outflows from Western investors create persistent cyclical headwind requiring lower near-term expectations despite positive August-September seasonal tailwind
Technical Landscape
Consolidating at $4,107 after +0.81% weekly gain (Jul 27-31), RSI at 52 showing neutral momentum recovery from prior oversold territory, price holding above $4,076 immediate support and testing $4,100-$4,170 resistance zone, but still well below 50-day MA (~$4,360) and 200-day MA (~$4,500) in broader downtrend from January $5,626 peak
Trend strength is low at 3/10, indicating weak directional conviction and potential for range-bound behaviour.
Risk-Reward Assessment
Primary risk: Renewed breakdown below $4,000 psychological support if July CPI prints hot confirming inflation persistence, Fed hawkish dissenters gain influence, and Middle East tensions de-escalate removing safe-haven bid — targeting $3,800-$3,600 major support zone representing additional 5-10% downside as structural floor fails (Probability: medium)
Primary opportunity: August-September seasonal tailwind (historically strongest period, September +2.1% average) combined with dovish July CPI surprise, record Q2 central bank buying validation, and continued geopolitical risk premium from Iran conflict driving gold recovery toward $4,400-$4,500 resistance within 4-6 weeks (Timeframe: Next 4-6 weeks through August 12 CPI, potential late-August Jackson Hole symposium, and into September as August-September seasonal strength window (historically strongest period) combines with Q2 2026 central bank buying data catalyst from July 30 World Gold Council report)
This week's edge: The market may be underestimating the structural significance of record Q2 2026 central bank gold buying (289 tonnes, +74% YoY) as a rising floor that progressively lifts gold prices regardless of Western ETF flows and real yield headwinds — this geographic bifurcation between Eastern official accumulation and Western institutional liquidation creates an asymmetric risk profile where downside is increasingly capped by sovereign buying while upside to $6,000+ institutional targets remains if real yields normalize or geopolitical risk escalates
Risk Environment
With vol at the 65th percentile over 90 days, gold price is in a measured regime that doesn't require unusual adjustments. Volatility is contracting, with realised vol declining across timeframes. Compressed volatility often precedes sharp directional moves as energy builds.
Normalized volatility at 65th percentile suggests 1.5-2.0% daily ranges typical for gold (current range $4,076-$4,170 showing ~2.3% intraday), providing favorable conditions for mean-reversion strategies near established support/resistance levels with reduced false-signal risk compared to the extreme volatility experienced during June breakdown phase; breakouts above $4,170 or below $4,076 gain reliability as volatility normalizes
Looking Forward
All eyes turn to July 2026 CPI release — critical data for assessing whether disinflation trend continues (PCE at 3.7%) or reaccelerates, directly impacting Fed rate cut timeline expectations and real yield trajectory that drives gold's opportunity cost dynamics on Wednesday 12 August, which carries enough weight to force a decisive directional move.
The week ahead for gold futures hinges on whether the prevailing consolidating regime can absorb the scheduled catalysts without a regime shift.
This analysis covers one dimension. Our full weekly report combines six specialist agents into a single actionable briefing with directional bias, key levels, and risk-opportunity matrix.
Start Free — Get the Market of the WeekFree weekly report · No credit card · Upgrade anytime



