Gold COT & Institutional Positioning — Smart Money Analysis
Gold institutional positioning: COT data, sentiment analysis and smart money flow assessment.

The Institutional Landscape
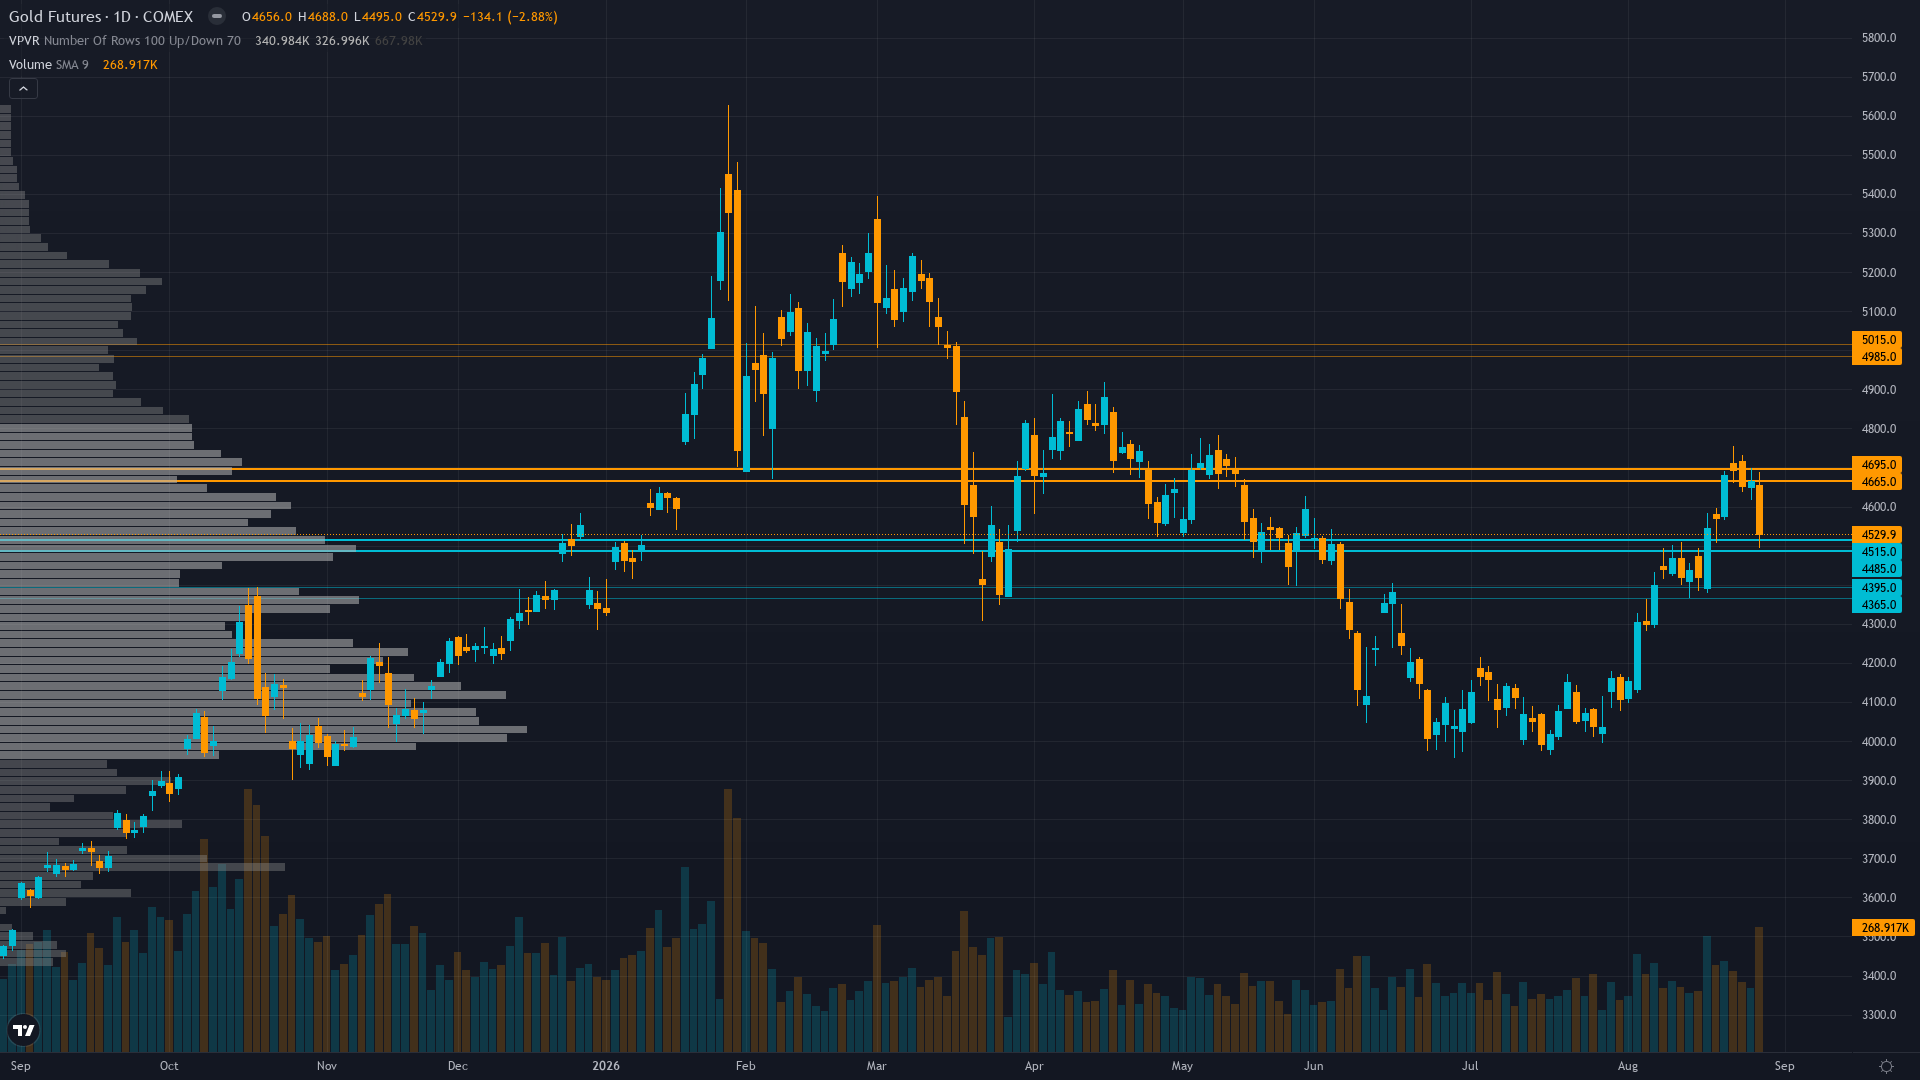
Trading at 4478.1 with a 0.72% dip, gold is giving back ground gradually.
Non-commercial net long +21,145 to 243,334 contracts (56.9% OI, 72.8th 3-year percentile) as of Aug 25 COT — still below 80th+ percentile extremes, with specs adding during the weekly pullback indicating conviction in the trend; Q2 central bank buying 289t provides structural demand floor
Market Consensus vs Our Analysis
Market consensus: Bullish on gold with near-term caution after the -3.16% weekly pullback, with consensus viewing the correction as a buying opportunity within an intact structural uptrend driven by USD weakness, rate-cut expectations, and record central bank buying
Primary driver: Gold consolidating after a -3.16% weekly pullback from $4,624 to $4,478, correcting from overbought levels following three consecutive bullish weeks (+15.8% cumulative), while the structural bull case remains intact with central bank buying at record levels and USD weakness supporting the macro backdrop
Contrarian Assessment
Mild divergence: the desk's BULLISH bias aligns with market consensus, but the specific insight that COT data showing specs adding +21,145 contracts during a -3.16% weekly decline represents bullish accumulation rather than distribution, combined with the underappreciated September seasonal tailwind beginning tomorrow, represents a nuanced magnitude difference rather than directional contrarian positioning
Sentiment & Positioning
Sentiment around gold futures is neutral, with no extreme positioning on either side. This balanced state often resolves when a catalyst breaks the equilibrium.
Options Market Signal
Insufficient current implied volatility data; put/call ratio of 0.401 from Aug 23 shows call dominance with increasing put activity noted, suggesting options market pricing modest directional uncertainty but no defensive skew; 20-day realised vol at 23.2% reflects normal trending conditions
Putting It Together
In summary, the positioning picture for gold reflects neutral conviction levels set against a consolidating market backdrop. Trend strength sits at 6/10, reflecting a market that has directional bias but hasn't reached extreme conviction. The interplay between smart money activity, retail sentiment, and options market signals will shape how this positioning resolves.
This analysis covers one dimension. Our full weekly report combines six specialist agents into a single actionable briefing with directional bias, key levels, and risk-opportunity matrix.
Start Free — Get the Market of the WeekFree weekly report · No credit card · Upgrade anytime



