Gold COT & Institutional Positioning — Smart Money Analysis

Gold institutional positioning: COT data, sentiment analysis and smart money flow assessment.

Share
Gold COT & Institutional Positioning — Smart Money Analysis
Gold
Week of 26 Jul 2026
CONSOLIDATING
Trend 3/10
Sentiment
FEAR
Market Regime
POST-CORRECTION CONSOLIDATION AT MAJOR PSYCHOLOGICAL SUPPORT AHEAD OF JULY 29 FOMC BINARY CATALYST WITH PRICE STABILIZING NEAR $4,000 FLOOR AFTER 28% BREAKDOWN FROM JANUARY HIGHS CREATING HOLDING PATTERN CHARACTERIZED BY LOW CONVICTION AND ELEVATED EVENT RISK

Smart Money Positioning

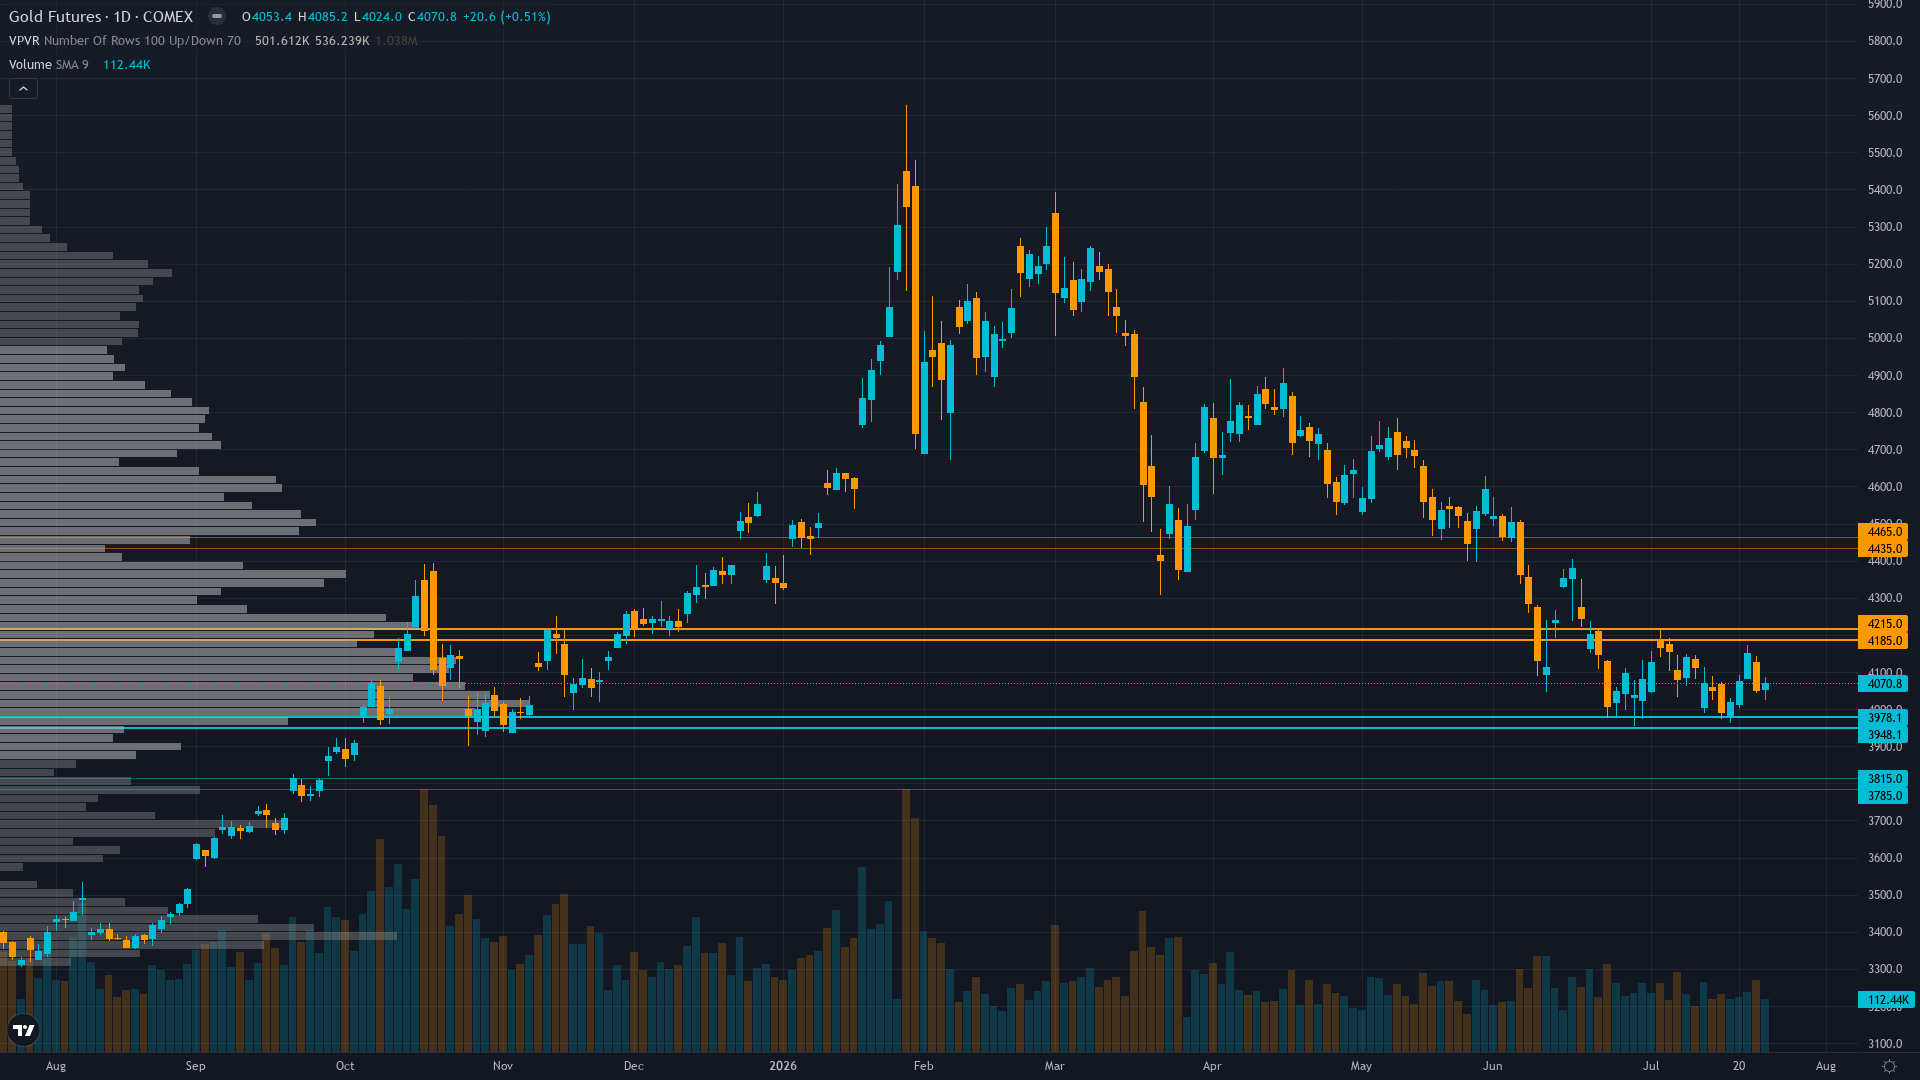
gold sits at 4070.8 after a 0.51% gain — a quiet move higher without aggressive momentum.

Managed Money net long surged to 120,779 contracts (highest in 6 months per July 14 COT) representing material positioning reset from prior capitulation, while Q1 central bank demand held at 244t (+3% YoY) validating structural bid floor intact despite June ETF outflows $8.9B demonstrating geographic bifurcation between Eastern official accumulation and Western retail/institutional liquidation

Sentiment & Positioning

Sentiment around gold futures is neutral, with no extreme positioning on either side. This balanced state often resolves when a catalyst breaks the equilibrium.

Options Market Signal

GVZ gold volatility at 24.88 as of July 2026 showing elevated but moderating conditions from January 48.68 spike reflecting post-correction stabilization, insufficient current options flow data for directional bias as discipline provides no actionable signal in precious metal confirming-only framework

Where We Agree & Diverge

Primary driver: July 29 FOMC binary catalyst 3 days away dominates forward outlook as gold stabilizes at $4,070 near critical $4,000 psychological support following 28% decline from January $5,626 peak, with market pricing 95-99% probability of hold but forward guidance on potential 2026 rate hikes carrying high uncertainty amid conflicting discipline signals

Net Assessment

The institutional landscape for gold price shows fear sentiment. Trend strength is low at 3/10, indicating weak directional conviction and potential for range-bound behaviour. The combination of positioning data, sentiment, and options flow provides context for understanding where smart money is leaning heading into the week.

Consensus vs Reality
Last Week's Consensus

“Deeply divided with institutional year-end targets ranging from $4,900 (Goldman Sachs revised down from $5,400 in June) to $6,300 (some bulls) maintaining structural case but near-term positioning increasingly bearish following June ETF outflows $8.9B and 28% correction from January peaks creating elevated tactical caution amid July seasonal weakness and July 29 FOMC binary event risk”

What Actually Happened
+1.37%
4015.75 → 4070.8
Common Questions
Where is Gold heading this week?

The current outlook for Gold depends on multiple factors including technical structure, institutional positioning, and macroeconomic conditions. Our multi-agent system analyses all of these dimensions weekly.

What catalysts are affecting Gold price action?

July 29 FOMC binary catalyst 3 days away dominates forward outlook as gold stabilizes at $4,070 near critical $4,000 psychological support following 28% decline from January $5,626 peak, with market pricing 95-99% probability of hold but forward guidance on potential 2026 rate hikes carrying high uncertainty amid conflicting discipline signals

How volatile is Gold right now?

Current Gold volatility sits at the ?th percentile of its 90-day range. The regime is normal with a stable trend across timeframes (5d: ?%, 20d: ?%, 60d: ?%).

What does historical seasonal data show for Gold?

Gold enters July 2026 with a neutral seasonal tendency (50% win rate historically). .

What does institutional positioning show for Gold?

Managed Money net long surged to 120,779 contracts (highest in 6 months per July 14 COT) representing material positioning reset from prior capitulation, while Q1 central bank demand held at 244t (+3% YoY) validating structural bid floor intact despite June ETF outflows $8.9B demonstrating geographic bifurcation between Eastern official accumulation and Western retail/institutional liquidation

Explore More
Want the Full Gold Intelligence Briefing?

This analysis covers one dimension. Our full weekly report combines six specialist agents into a single actionable briefing with directional bias, key levels, and risk-opportunity matrix.

Start Free — Get the Market of the Week

Free weekly report · No credit card · Upgrade anytime