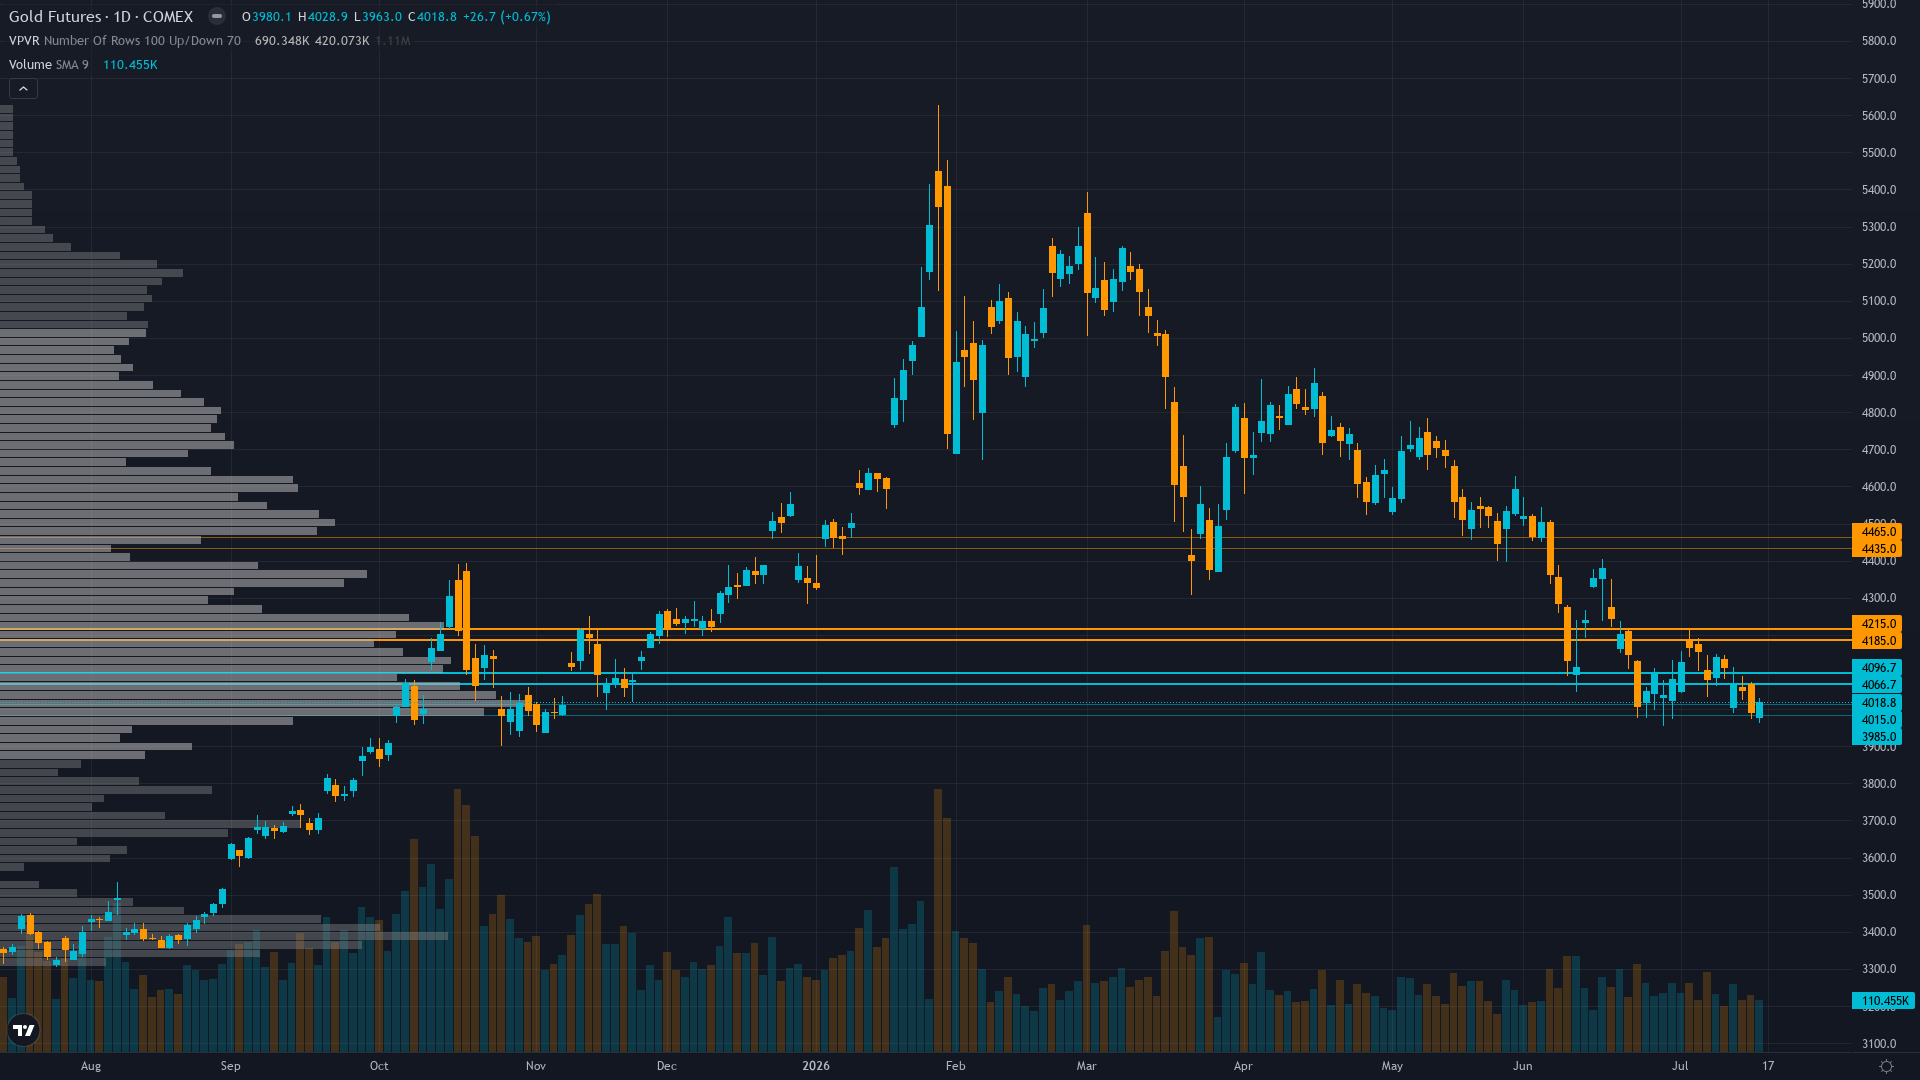
RISK-ON DIVERGENT REGIME WITH VIX AT 15.67 WELL BELOW 20 THRESHOLD SIGNALING NORMALIZED EQUITY RISK APPETITE AND BROAD MARKET COMPLACENCY YET GOLD PARADOXICALLY EXTENDS BREAKDOWN -28% FROM JANUARY HIGHS DESPITE TRADITIONAL SAFE-HAVEN STATUS, REVEALING MONETARY POLICY RECALIBRATION (FED HIGHER-FOR-LONGER AT 3.50-3.75% WITH JULY 28-29 FOMC 10 DAYS AWAY) IS OVERRIDING HAVEN DEMAND DYNAMICS CREATING ENVIRONMENT WHERE EQUITY CALM COINCIDES WITH PRECIOUS METAL CAPITULATION DRIVEN BY REAL YIELD TRAJECTORY RATHER THAN SYSTEMIC STRESS
Smart Money Positioning
gold is trading at 4015.75, up a modest 0.39% as the market edges higher.
Managed money net long at 96,931 contracts in lower-middle percentile after Q1 flush from 441k September 2024 peak representing massive positioning unwind, while GLD ETF hemorrhaged $14.4B since March 1 with June alone posting $8.9B global outflows ($5.3B US), yet Q1 central bank demand 244t with 45% expecting higher allocations validates structural bid floor intact creating geographic bifurcation between Western capitulation and Eastern accumulation
Sentiment & Positioning
Sentiment around gold futures is neutral, with no extreme positioning on either side. This balanced state often resolves when a catalyst breaks the equilibrium.
Options Market Signal
GVZ gold volatility elevated but unable to retrieve current IV data for directional assessment though elevated volatility context from 27.41 levels reflects post-correction uncertainty, options discipline provides no actionable signal as confirming-only input in precious metal framework with insufficient current flow data
Where We Agree & Diverge
Market consensus: Deeply divided with institutional year-end targets ranging from $4,900 (Goldman Sachs revised down from $5,400 in June) to $6,300 (some bulls) maintaining structural case but near-term positioning increasingly bearish following June ETF outflows $8.9B and 28% correction from January peaks creating elevated tactical caution amid July seasonal weakness and July 29 FOMC binary event risk
Primary driver: MANDATORY MISS RESET PROTOCOL: 11 consecutive MISSED graded calls catastrophically exceeding the 4-miss threshold for GC requires NEUTRAL stance per Rule 5 while gold tests critical $4,000 psychological support (currently $4,015.75 as of July 17, 2026) down 28% from January $5,626 peak following June ETF outflows of $8.9B and July real yield pressures creating historic breakdown
Net Assessment
The institutional landscape for gold price shows fear sentiment. Trend strength is low at 2/10, indicating weak directional conviction and potential for range-bound behaviour. The combination of positioning data, sentiment, and options flow provides context for understanding where smart money is leaning heading into the week.
Consensus vs Reality
Last Week's Consensus
“Deeply divided with institutional year-end targets ranging from $4,900 (Goldman Sachs revised lower) to $6,300 (JPMorgan) maintaining structural bull case but near-term positioning increasingly bearish following July 1 Treasury yield shock, June ETF outflows $5.3B, and 27% correction from January peaks creating elevated tactical caution amid July seasonal weakness”
▼
What Actually Happened
-2.38%
4113.7 → 4015.75
Common Questions
Where is Gold heading this week?
Deeply divided with institutional year-end targets ranging from $4,900 (Goldman Sachs revised down from $5,400 in June) to $6,300 (some bulls) maintaining structural case but near-term positioning increasingly bearish following June ETF outflows $8.9B and 28% correction from January peaks creating elevated tactical caution amid July seasonal weakness and July 29 FOMC binary event risk
What catalysts are affecting Gold price action?
MANDATORY MISS RESET PROTOCOL: 11 consecutive MISSED graded calls catastrophically exceeding the 4-miss threshold for GC requires NEUTRAL stance per Rule 5 while gold tests critical $4,000 psychological support (currently $4,015.75 as of July 17, 2026) down 28% from January $5,626 peak following June ETF outflows of $8.9B and July real yield pressures creating historic breakdown
How volatile is Gold right now?
Current Gold volatility sits at the 82th percentile of its 90-day range. The regime is high with a contracting trend across timeframes (5d: 26.5%, 20d: 28.8%, 60d: 24.2%).
What does historical seasonal data show for Gold?
Gold enters July 2026 with a neutral seasonal tendency (50% win rate historically). .
What does institutional positioning show for Gold?
Managed money net long at 96,931 contracts in lower-middle percentile after Q1 flush from 441k September 2024 peak representing massive positioning unwind, while GLD ETF hemorrhaged $14.4B since March 1 with June alone posting $8.9B global outflows ($5.3B US), yet Q1 central bank demand 244t with 45% expecting higher allocations validates structural bid floor intact creating geographic bifurcation between Western capitulation and Eastern accumulation
This analysis covers one dimension. Our full weekly report combines six specialist agents into a single actionable briefing with directional bias, key levels, and risk-opportunity matrix.