Crude Oil Key Levels This Week — Support, Resistance & Confluence Zones
Crude Oil key levels breakdown: support zones, resistance zones, confluence and price structure.

Structural Assessment
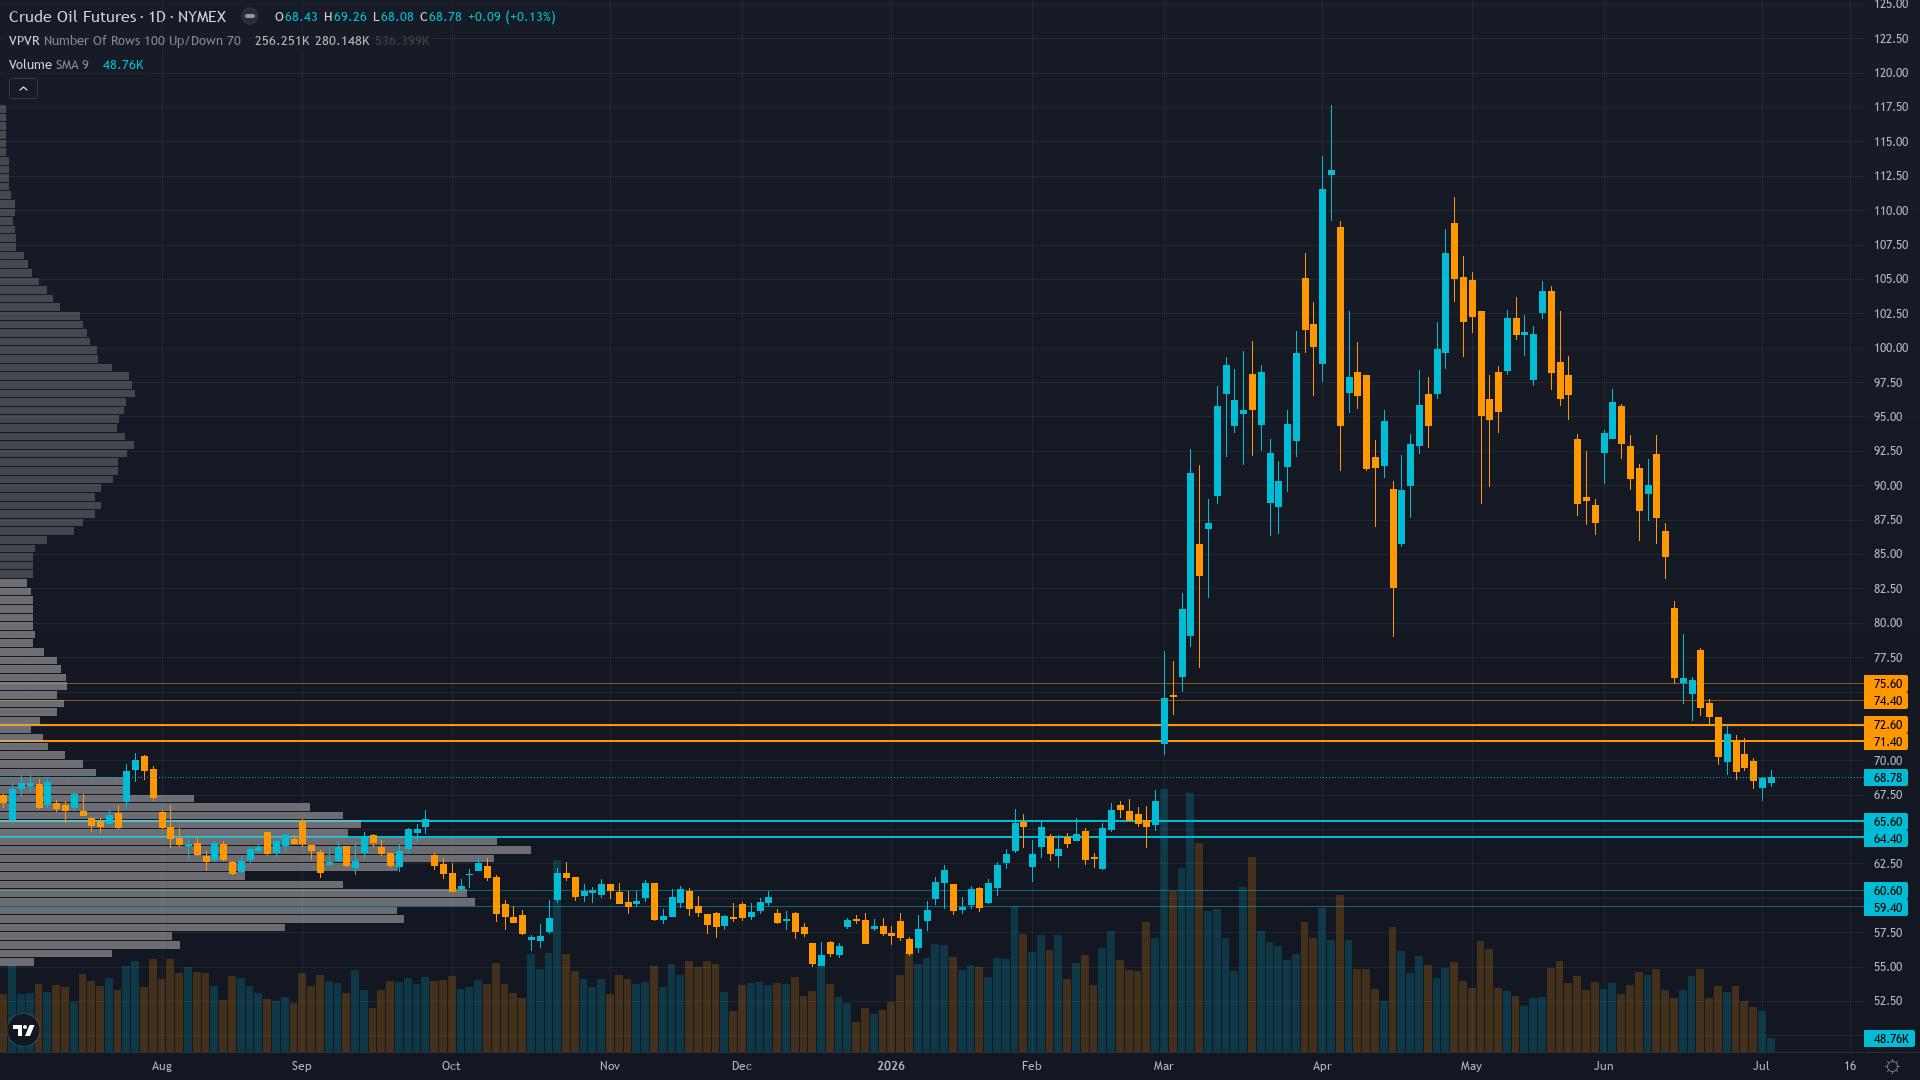
crude oil is trading at 68.86, down 0.12% in a measured pullback. crude oil futures is in a breaking down market state, requiring careful assessment of current conditions.
Confirmed downtrend extreme capitulation phase - WTI at $68.86 lowest since February 2026, catastrophically below 50-day MA $126.05 and 200-day MA $137.35, symmetrical triangle breakdown July 1 confirmed, RSI 25.13 deeply oversold indicating potential exhaustion of selling pressure despite bearish momentum persisting, creating void toward $60-65 range yet oversold conditions suggest bounce risk
At 2/10, trend strength is subdued, suggesting the market lacks a clear directional mandate.
Support Architecture
Support levels for crude oil are defined by zones of prior institutional demand. The depth and frequency of prior tests at these levels determines their likely strength.
The strength of support depends on the current geopolitical premium mean reversion COMPLETE transitioning to potential sentiment capitulation overshoot within structural demand destruction framework regime and volume profile at each level.
Upside Barriers
Resistance levels above WTI crude current price represent zones of historical supply. The significance of each level scales with the number of prior tests and the volume traded there.
The current breaking down regime influences how aggressively these resistance zones are likely to be tested and whether they hold or fold.
Confluence & Methodology
Confluence is the differentiator between a line on a chart and a level worth trading. For crude oil futures, the zones with the highest conviction are those validated across technical, institutional, and derivatives dimensions simultaneously.
High but contracting volatility requires moderately wide stops; expect 3-5% daily ranges currently versus 6-8% during peak conflict and 2-3% normal, as peace talks create episodic headline risk but overall volatility declining from peak levels; intraday volatility moderating suggests market adapting to normalization framework with directional resolution likely around mid-July peace outcomes
Beyond Lines on a Chart
Our approach to key levels is designed to filter noise from signal. Six independent agents each assess the same price zones from different perspectives. A level confirmed by one discipline is interesting. A level confirmed by four or five is worth building a trade plan around.
This multi-discipline approach means the levels in our paid reports carry institutional-grade confluence — not just lines on a chart, but zones validated across every analytical dimension that matters.
Our paid reports include specific support and resistance levels identified by six specialist agents — technical structure, institutional positioning, options flow, fundamentals, sentiment, and economic analysis. Not just lines on a chart, but zones validated by multi-discipline confluence.
Start Free — Get the Market of the WeekFree weekly report · No credit card · Upgrade anytime



