Crude Oil Forecast This Week — Outlook, Drivers & Key Levels
This week's Crude Oil outlook: key drivers, volatility context, risk-opportunity assessment and the week ahead.

Current Market Picture
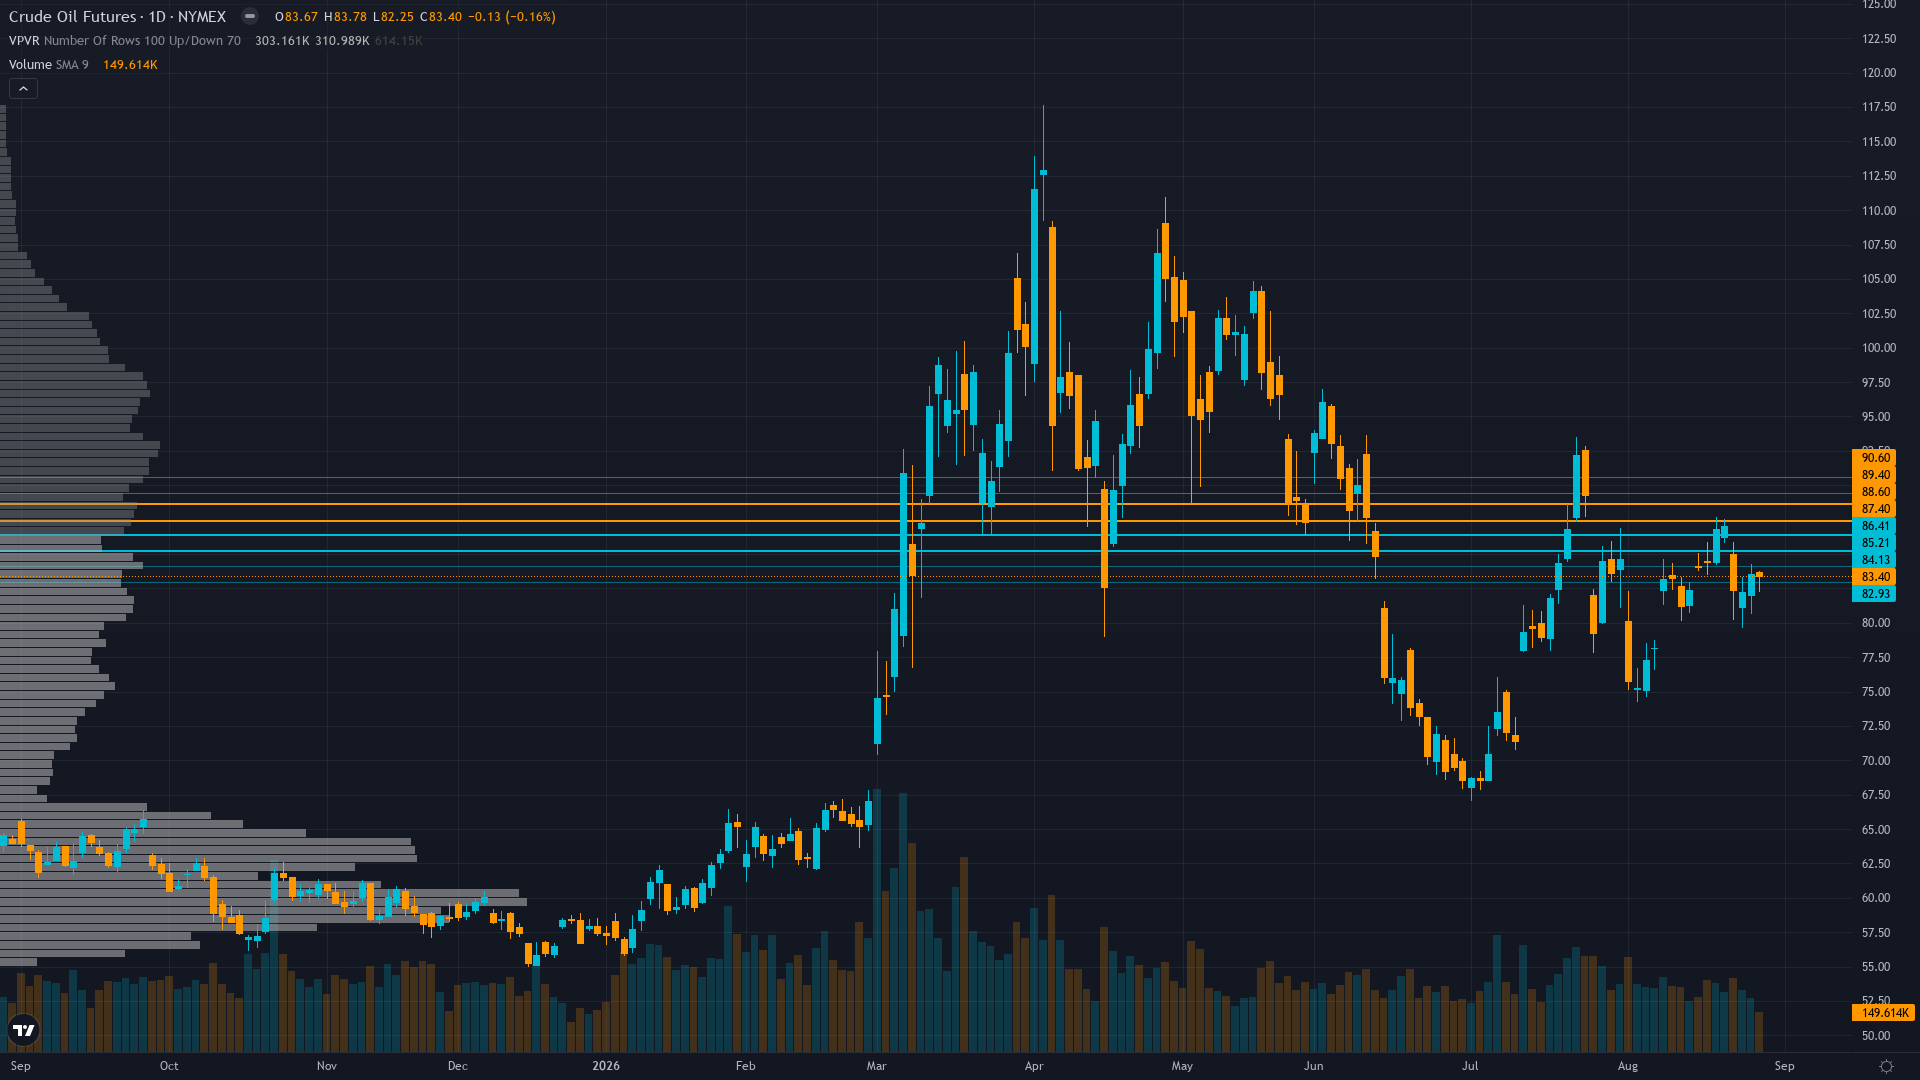
crude oil is trading at 83.4, up a modest 0.30% as the market edges higher. The market in crude oil futures is coiling, with narrowing price ranges suggesting stored energy that will eventually release.
Market pricing a chronic Hormuz stalemate at $82-85 — neither the full geopolitical crisis premium ($90+) nor the structural oversupply floor ($74-77) is reflected, as traders wait for either diplomatic breakthrough or renewed escalation to resolve the 6-month impasse
Key Drivers This Week
Primary driver: Strait of Hormuz physical disruption persists with tanker transits still well below pre-war levels and spot rates at $650,000/day (10x normal), but U.S. pivot to economic pressure on Iran (CNBC Aug 25) reduces war escalation risk, trapping WTI near $83.40 in a zone where neither bullish supply disruption premium nor bearish demand destruction thesis dominates
Secondary factor: EIA August 25 STEO forecasts Brent averaging ~$85/bbl in Q3 2026 and declining to $69/bbl in 2027 as inventories rebuild, providing a fundamental ceiling that caps upside at current levels while the $80-85 range reflects messy equilibrium between constrained supply and softening demand
Additional influence: Non-commercial positioning at 22.2nd percentile (CFTC COT Aug 25) shows speculative length remains lean with room to build on either side, but the 4-week string of MISSED graded calls forces a mandatory neutral reset under Rule 5, removing conviction from any directional assessment this cycle
Economic backdrop: DIVERGENT macro regime — VIX at ~15 signals broad risk appetite, but energy complex trades on its own physical supply disruption dynamics; US inflation stable at 2.31%, Fed on hold at 3.63%, yield curve steeper at +39bp 2s10s; ISM Manufacturing PMI (Sep 1, est 55.3) and EIA inventories (Sep 2) are key near-term catalysts
Fundamental assessment: Crude modestly overvalued 15-20% vs marginal production costs of $61-70/bbl per EIA breakeven analysis, but current $83.40 aligns closely with EIA Q3 2026 Brent forecast of ~$85, suggesting the geopolitical risk premium is partially but not fully priced into equilibrium
Price Structure
WTI at $83.40 below both 50-day (~$85) and 200-day (~$87) moving averages in the lower half of the 52-week range at 48.8%, with daily RSI neutral and volume thinning on the recent decline indicating consolidation rather than directional momentum
Trend strength registers just 3/10, which typically corresponds to choppy, directionless price action.
Upside & Downside
Primary risk: Sudden Hormuz diplomatic breakthrough reopens strait to 80%+ capacity, removing residual supply disruption premium and triggering violent price collapse toward $74-77 as EIA structural oversupply projections reassert dominance through Q4 2026 (Probability: medium)
Primary opportunity: Renewed Iran hardline position or Hormuz tanker attacks escalate, forcing repricing of geopolitical risk premium back toward $88-92 as the market discovers the 6-month crisis is structural not cyclical and physical supply remains acutely constrained with tanker rates at 10x normal (Timeframe: 1-3 weeks as U.S.-Iran diplomatic track (economic pressure pivot) either makes progress or fails to produce results)
This week's edge: Resetting after 4 consecutive misses — thesis under review. The market has correctly priced a messy Hormuz stalemate at $83.40 where neither bullish (physical tightness, tanker crisis) nor bearish (demand destruction, EIA oversupply projections) narratives dominate. The desk's edge this cycle is recognizing that the 4-miss streak demands restraint, not conviction. Physical market indicators (tanker rates, insurance costs) suggest more supply stress than the paper $83.40 reflects, but the EIA's forward curve ($69 Brent by 2027) and record US production create a fundamental ceiling that makes bullish conviction unsupported. NEUTRAL is the only integrity-compliant stance.
Volatility Context
At the 65th percentile, oil price volatility sits in a normal range, neither compressed enough to signal a breakout nor elevated enough to demand caution. Realised vol is declining steadily, compressing into ranges that tend to snap when a catalyst breaks the equilibrium.
Normal contracting volatility supports range-bound trading with expected daily ranges of $1.50-2.50; the $82-85 trading band is well-defined; stop placement at $1.50-2.00 below entry is appropriate given current ATR; trend-following strategies are unreliable in this range-bound chronic stalemate regime
Week Ahead Outlook
The next major catalyst is ISM Manufacturing PMI (Aug) — est 55.3, prior 55.6 — key demand signal for crude on Tuesday 1 September — a high-impact event that could materially shift the directional picture.
For CL futures, the balance between existing momentum and scheduled risk events sets the stage for the week ahead.
This analysis covers one dimension. Our full weekly report combines six specialist agents into a single actionable briefing with directional bias, key levels, and risk-opportunity matrix.
Start Free — Get the Market of the WeekFree weekly report · No credit card · Upgrade anytime



