Crude Oil Forecast This Week — Outlook, Drivers & Key Levels
This week's Crude Oil outlook: key drivers, volatility context, risk-opportunity assessment and the week ahead.

Where Things Stand
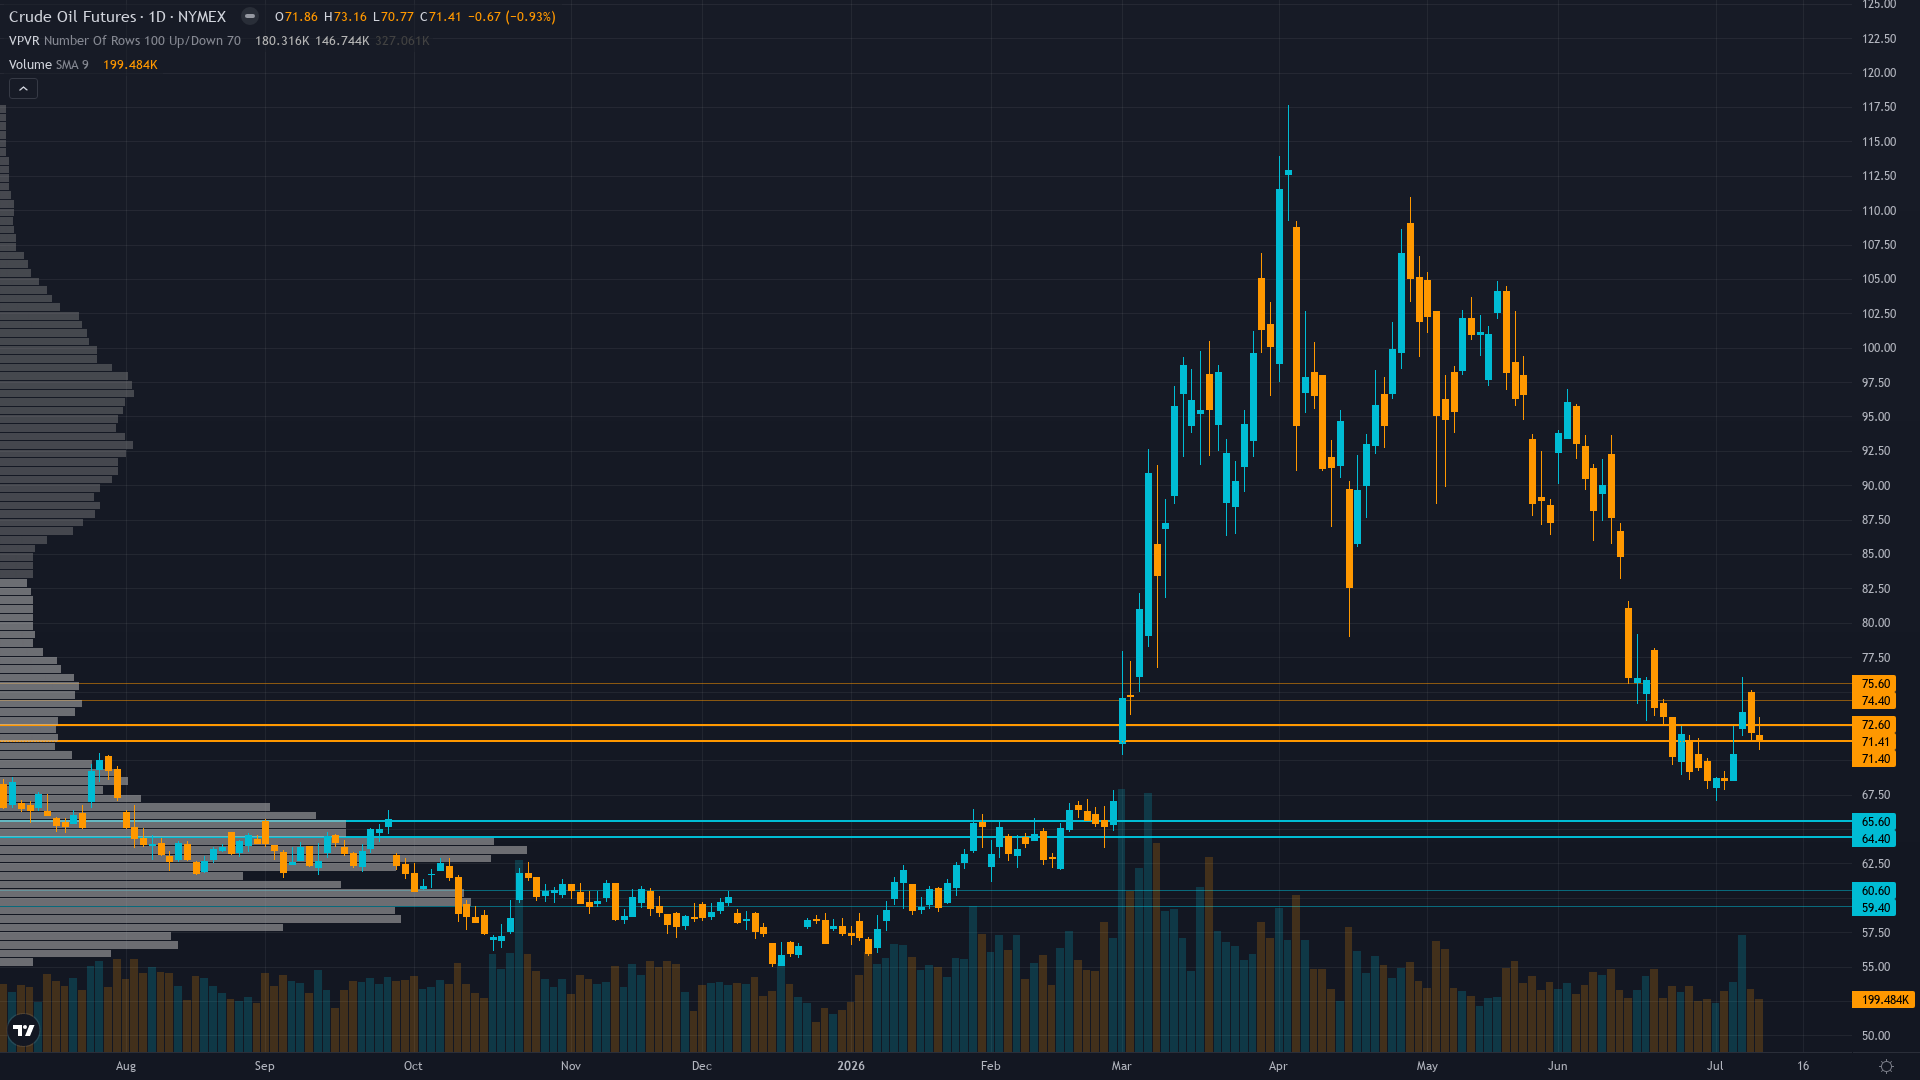
At 71.41, crude oil has eased 0.93% in a controlled retreat. crude oil futures is in a breaking down market state, requiring careful assessment of current conditions.
Tactically uncertain with market having completed mean reversion as current $71.41 WTI at pre-war February levels MINUS $2 per IEA July 10 report; structural oversupply consensus (IEA 4.7 mb/d surplus, EIA -1.2 mb/d demand decline) validates bearish fundamental picture yet current pricing suggests full discounting with minimal remaining edge as U.S.-Iran MOU June 18 removes last geopolitical catalyst
What's Driving Price
Primary driver: Geopolitical premium complete exhaustion as WTI collapsed 40% from March $120 peak to current $71.41 following Strait of Hormuz normalization (U.S.-Iran MOU signed June 18), while IEA July 2026 report confirms global oil demand declining 1.0 mb/d in 2026 creating structural oversupply as OPEC+ announces 188k bpd August production increase into weakening market
Secondary factor: Technical capitulation phase with WTI at $71.41 trading at pre-war February 2026 levels and $2/bbl below pre-crisis pricing per IEA July 10 report, yet 12 consecutive BEARISH weeks (200% beyond 6-week review threshold) with RSI 42 and deeply oversold conditions create maximum mandatory thesis re-examination despite 8 of last 10 calls CORRECT
Additional influence: Fundamental valuation crossover as current $71.41 trades BELOW most analyst fair value estimates ($85-90 range per prior Fundamental assessments), indicating geopolitical premium 100% unwound with market potentially overshooting to downside on sentiment exhaustion rather than reflecting ongoing supply-demand fundamentals as EIA projects -1.2M bpd demand contraction
Economic backdrop: MACRO REGIME: RISK-ON - VIX 15.03-16.45 (July 10-11, well below 20 calm threshold) indicating geopolitical risk successfully contained to energy sector; Fed showing hawkish shift with 22% probability July 28-29 hike (up from near-zero) creating higher-for-longer demand headwind; CRITICAL POST-INPUT: U.S.-Iran MOU signed June 18 per EIA July STEO validates normalization trajectory as Strait traffic recovering per NYT July 6; IEA July report shows North Sea Dated at $68 by early July, $2 below pre-war levels confirming complete war premium unwind; EIA July STEO demand destruction -1.2M bpd 2026 remains valid structural ceiling
Fundamental assessment: Crude at or BELOW fundamental fair value at $71.41; current pricing at pre-war February levels per IEA July 10 report ($68 North Sea Dated, $2 below pre-war) suggests geopolitical premium 100% exhausted with IEA July 2026 showing -1.0 mb/d demand decline 2026 and EIA -1.2 mb/d validating structural bearish picture, yet valuation crossover at current levels creates 0-5% tactical support versus limited remaining downside
Chart Assessment
Confirmed downtrend extreme exhaustion - WTI $71.41 lowest since pre-war February 2026, catastrophically below 50-day MA ~$78-80 and 200-day MA ~$85-90, RSI 42 weak momentum but out of panic oversold, technical breakdown complete yet at pre-crisis pricing suggesting selling climax characteristics
With trend strength at only 2/10, any directional bias is thin and easily disrupted.
Risk & Opportunity
Primary risk: Sentiment capitulation reversal as deeply oversold conditions (12-week consecutive BEARISH at 200% of review threshold, RSI 42, price at pre-war levels per IEA) and valuation at/below fair value estimates triggers short-covering rally back toward $75-78 normalized range, invalidating continued directional bearish positioning at exhausted levels where geopolitical premium completely removed (Probability: medium)
Primary opportunity: Final leg toward $60-65 structural floor if China demand destruction (June 6 mb/d import collapse) persists and IEA projected oversupply overwhelms, creating 8-13% additional downside within 2-3 weeks, though probability declining as current $71.41 already at pre-war February levels per IEA July 10 report suggesting valuation support building at levels approaching fundamental equilibrium (Timeframe: 2-3 weeks through late July as July 28-29 FOMC and China July import data (due early August) validates whether demand destruction structural or temporary)
This week's edge: Market may be underweighting China June import collapse magnitude (6 mb/d lowest since October 2016) and OPEC+ July 6 production increase into weak demand, yet current $71.41 pricing at pre-war levels MINUS $2 per fresh IEA July 10 data suggests bearish thesis already fully priced; 12-week BEARISH streak at 200% of review threshold with 50% contrary weeks in last 4 creates LOW edge environment despite structural fundamentals remaining bearish—conviction 3 reflects exhausted positioning and unfavorable risk/reward at current levels where geopolitical premium 100% removed and valuation support building
Looking Forward
All eyes turn to EIA Weekly Petroleum Status Report following 12-week 40% collapse from $120 to $71.41 and confirmation via July 10 IEA report that crude is now at pre-war pricing levels, providing inventory validation of whether Strait normalization and demand destruction have created sustainable floor or further downside toward $65-68 structural support on Wednesday 15 July, which carries enough weight to force a decisive directional move.
The week ahead for crude oil hinges on whether the prevailing breaking down regime can absorb the scheduled catalysts without a regime shift.
This analysis covers one dimension. Our full weekly report combines six specialist agents into a single actionable briefing with directional bias, key levels, and risk-opportunity matrix.
Start Free — Get the Market of the WeekFree weekly report · No credit card · Upgrade anytime



