Copper Key Levels This Week — Support, Resistance & Confluence Zones
Copper key levels breakdown: support zones, resistance zones, confluence and price structure.

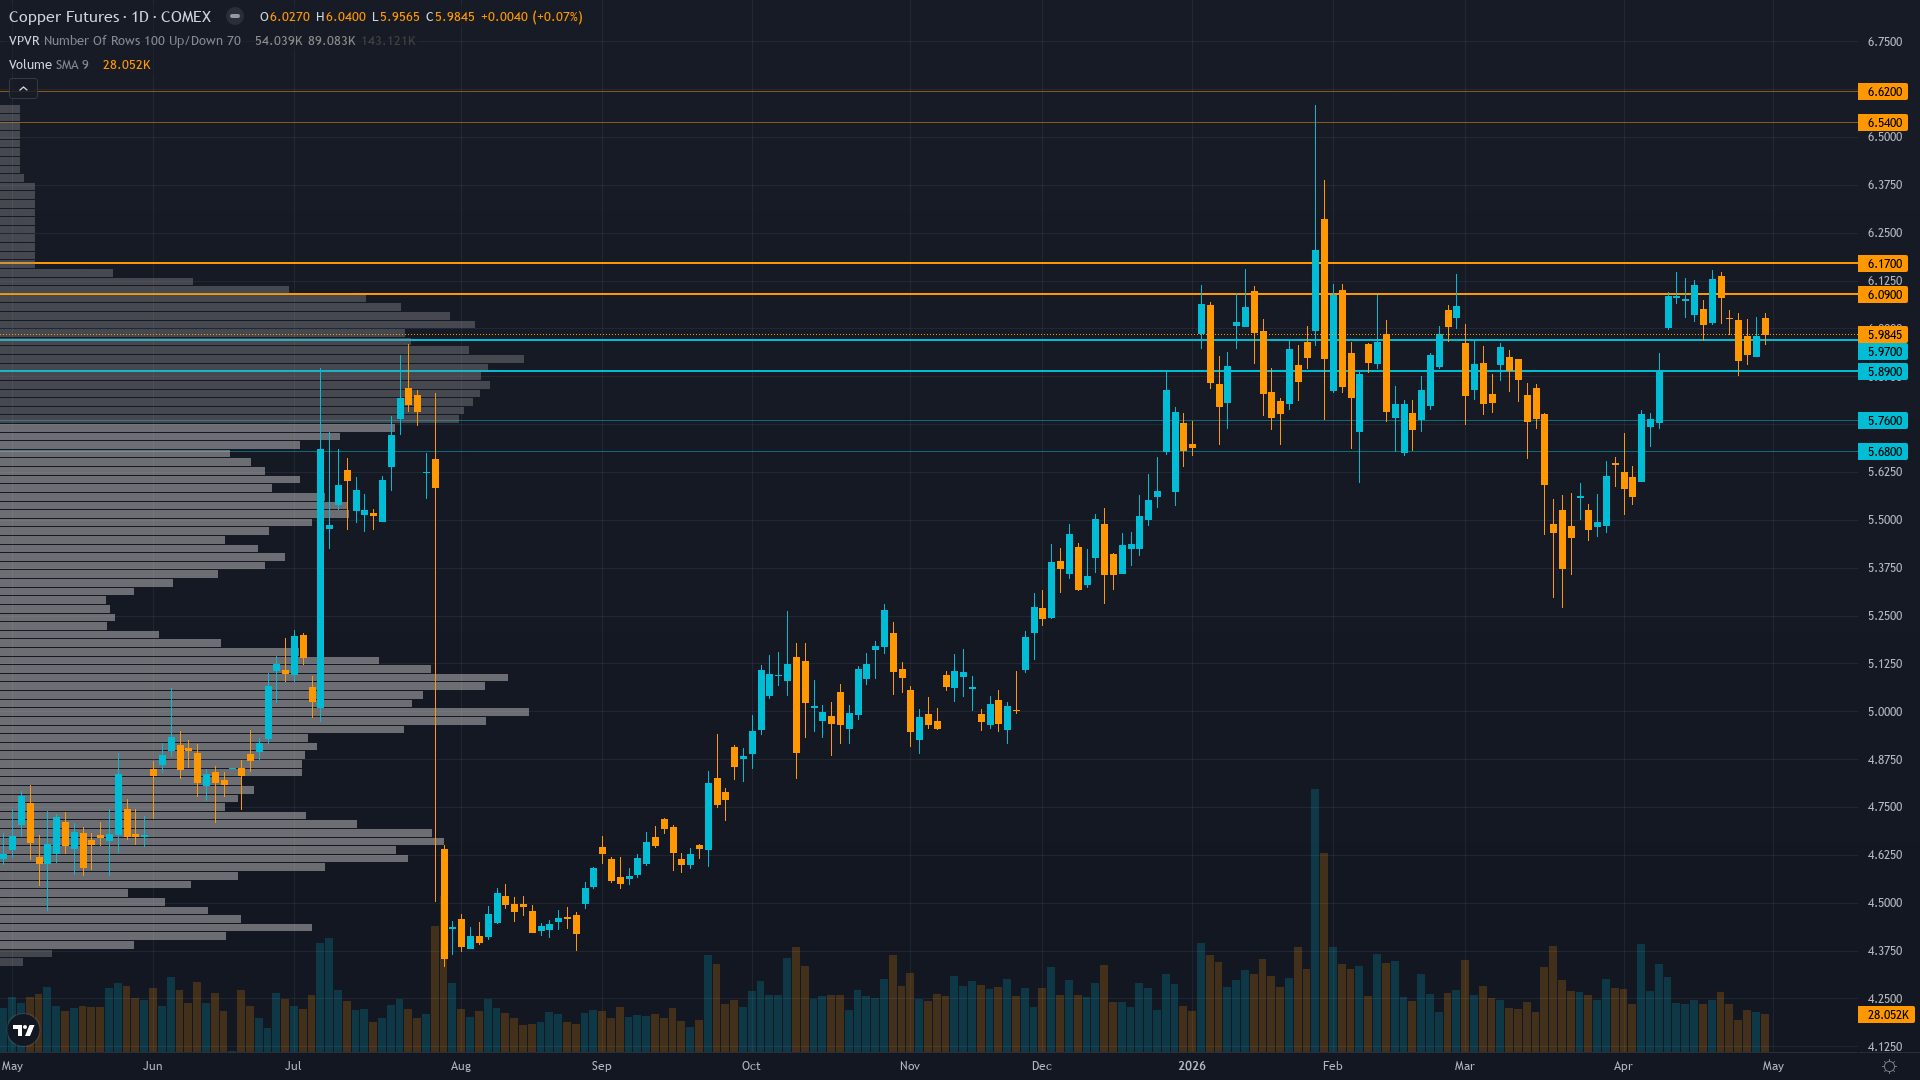
Current Price Structure
Trading at 6.01 with a 0.67% uptick, copper is drifting higher without strong conviction. copper futures is range-bound and tightening, with decreasing volatility signalling a directional resolution ahead.
Daily uptrend intact above 50-day and 200-day moving averages with RSI 68-70 showing positive momentum without overbought extremes, price consolidating 9% below January $6.58 52-week high at 72nd percentile of annual range
With trend strength at 6/10, there's a clear directional tilt but room for the move to develop further.
Support Zone Context
Below the current level, COMEX copper has structural support where demand has historically stepped in. The reliability of these zones depends on the volume profile and the number of prior interactions.
In the current consolidating from January record highs within RISK-ON macro regime as supply crisis fundamentals persist despite demand trajectory uncertainty environment, support zones carry standard probability of reaction.
Ceilings & Supply Zones
Above current price, copper futures faces resistance zones where selling pressure has historically intensified. These levels represent previous supply zones, profit-taking areas, or structural barriers that price needs to overcome for continuation.
How firmly these zones hold depends on the confluence of volume, prior reactions, and the current market regime.
Where Disciplines Converge
For COMEX copper, the levels that matter most are those confirmed by independent analytical approaches. When six different disciplines identify the same zone, the signal-to-noise ratio improves dramatically.
Current 28.5% short-term volatility (5-day) suggests daily ranges of 2-3% versus normal 1.5-2%, record high consolidation showing controlled price action rather than blow-off top characteristics with tightening ranges since mid-April indicating digestion phase nearing completion ahead of May 11-15 catalyst events, supply-driven rallies historically more sustainable than monetary-driven moves creating confidence in trend continuation potential
How Macro Agent Desk Identifies Key Levels
Macro Agent Desk identifies key levels through a six-agent process. Each analytical discipline contributes independently — technical for structure, institutional for smart money interest, options for hedging activity, fundamentals for fair value context, sentiment for crowd positioning, and economics for catalyst timing.
What this means in practice: every key level in the full weekly report has been stress-tested across multiple independent analytical frameworks before it reaches the page.
Our paid reports include specific support and resistance levels identified by six specialist agents — technical structure, institutional positioning, options flow, fundamentals, sentiment, and economic analysis. Not just lines on a chart, but zones validated by multi-discipline confluence.
Start Free — Get the Market of the WeekFree weekly report · No credit card · Upgrade anytime


