Soybeans Key Levels This Week — Support, Resistance & Confluence Zones
Soybeans key levels breakdown: support zones, resistance zones, confluence and price structure.

Structural Assessment
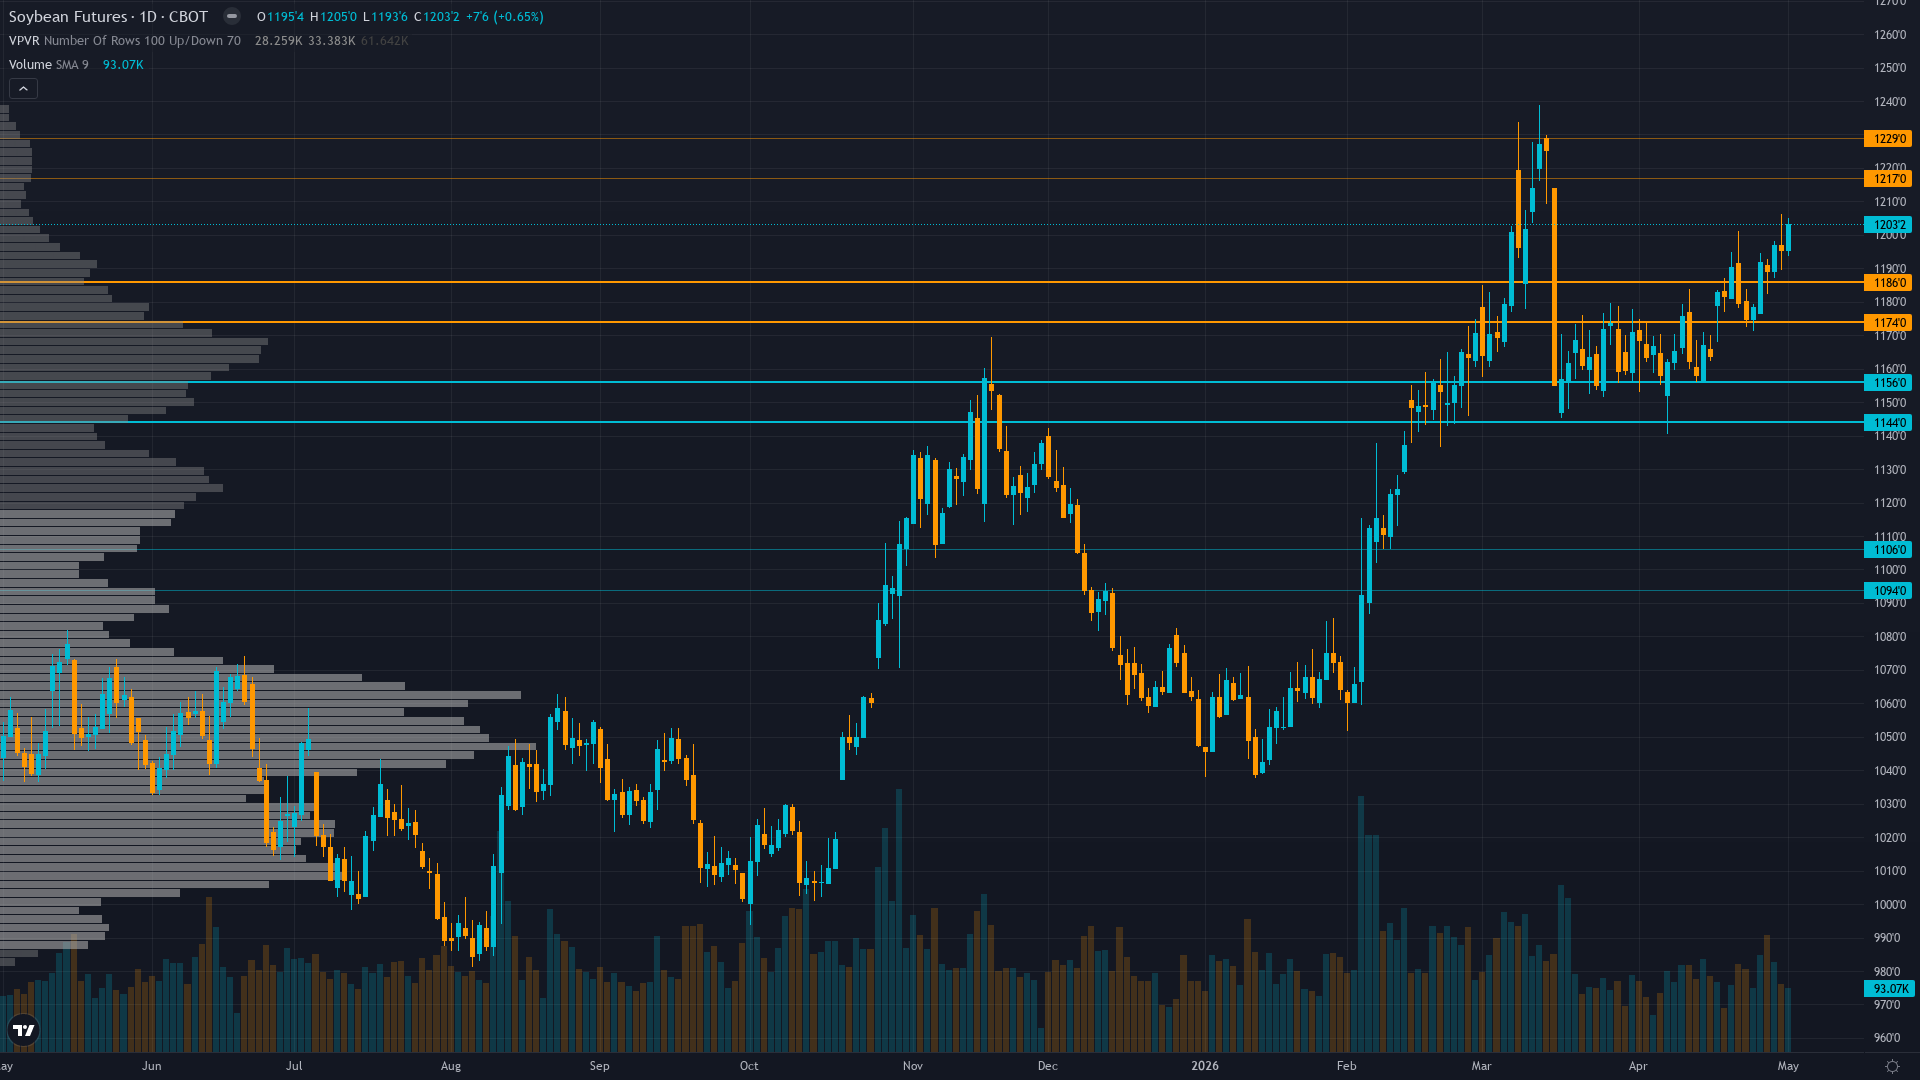
At 1201.5, soybeans has inched 0.52% higher in a measured advance. soybean futures is in a consolidating near highs market state, requiring careful assessment of current conditions.
Consolidating at 1201.50 cents near 52-week high of 1223.25 with Strong Buy technical ratings from moving average alignment, momentum constructive but approaching overbought levels with price holding above psychological 1200 level after breaking out from 1175 base
At 6/10, trend strength indicates a solid directional lean without being overextended.
Support Architecture
Support levels for soybeans are defined by zones of prior institutional demand. The depth and frequency of prior tests at these levels determines their likely strength.
The strength of support depends on the current Post-breakout consolidation testing whether renewable diesel structural bid can support elevated prices at extremes of speculative positioning range regime and volume profile at each level.
Upside Barriers
Resistance levels above CBOT soybeans current price represent zones of historical supply. The significance of each level scales with the number of prior tests and the volume traded there.
The current consolidating near highs regime influences how aggressively these resistance zones are likely to be tested and whether they hold or fold.
Confluence & Methodology
Confluence is the differentiator between a line on a chart and a level worth trading. For soybean futures, the zones with the highest conviction are those validated across technical, institutional, and derivatives dimensions simultaneously.
Current normal volatility at 60th percentile suggests 15-20 cent daily ranges near typical agricultural baseline, consolidation patterns likely with false breakouts common requiring patience for directional conviction, standard stop placement appropriate at 20-25 cents for positioning with May 12 WASDE binary risk warranting wider 30-35 cent stops for event exposure
Beyond Lines on a Chart
Our approach to key levels is designed to filter noise from signal. Six independent agents each assess the same price zones from different perspectives. A level confirmed by one discipline is interesting. A level confirmed by four or five is worth building a trade plan around.
This multi-discipline approach means the levels in our paid reports carry institutional-grade confluence — not just lines on a chart, but zones validated across every analytical dimension that matters.
Our paid reports include specific support and resistance levels identified by six specialist agents — technical structure, institutional positioning, options flow, fundamentals, sentiment, and economic analysis. Not just lines on a chart, but zones validated by multi-discipline confluence.
Start Free — Get the Market of the WeekFree weekly report · No credit card · Upgrade anytime


