Silver COT & Institutional Positioning — Smart Money Analysis
Silver institutional positioning: COT data, sentiment analysis and smart money flow assessment.

Where Institutions Stand
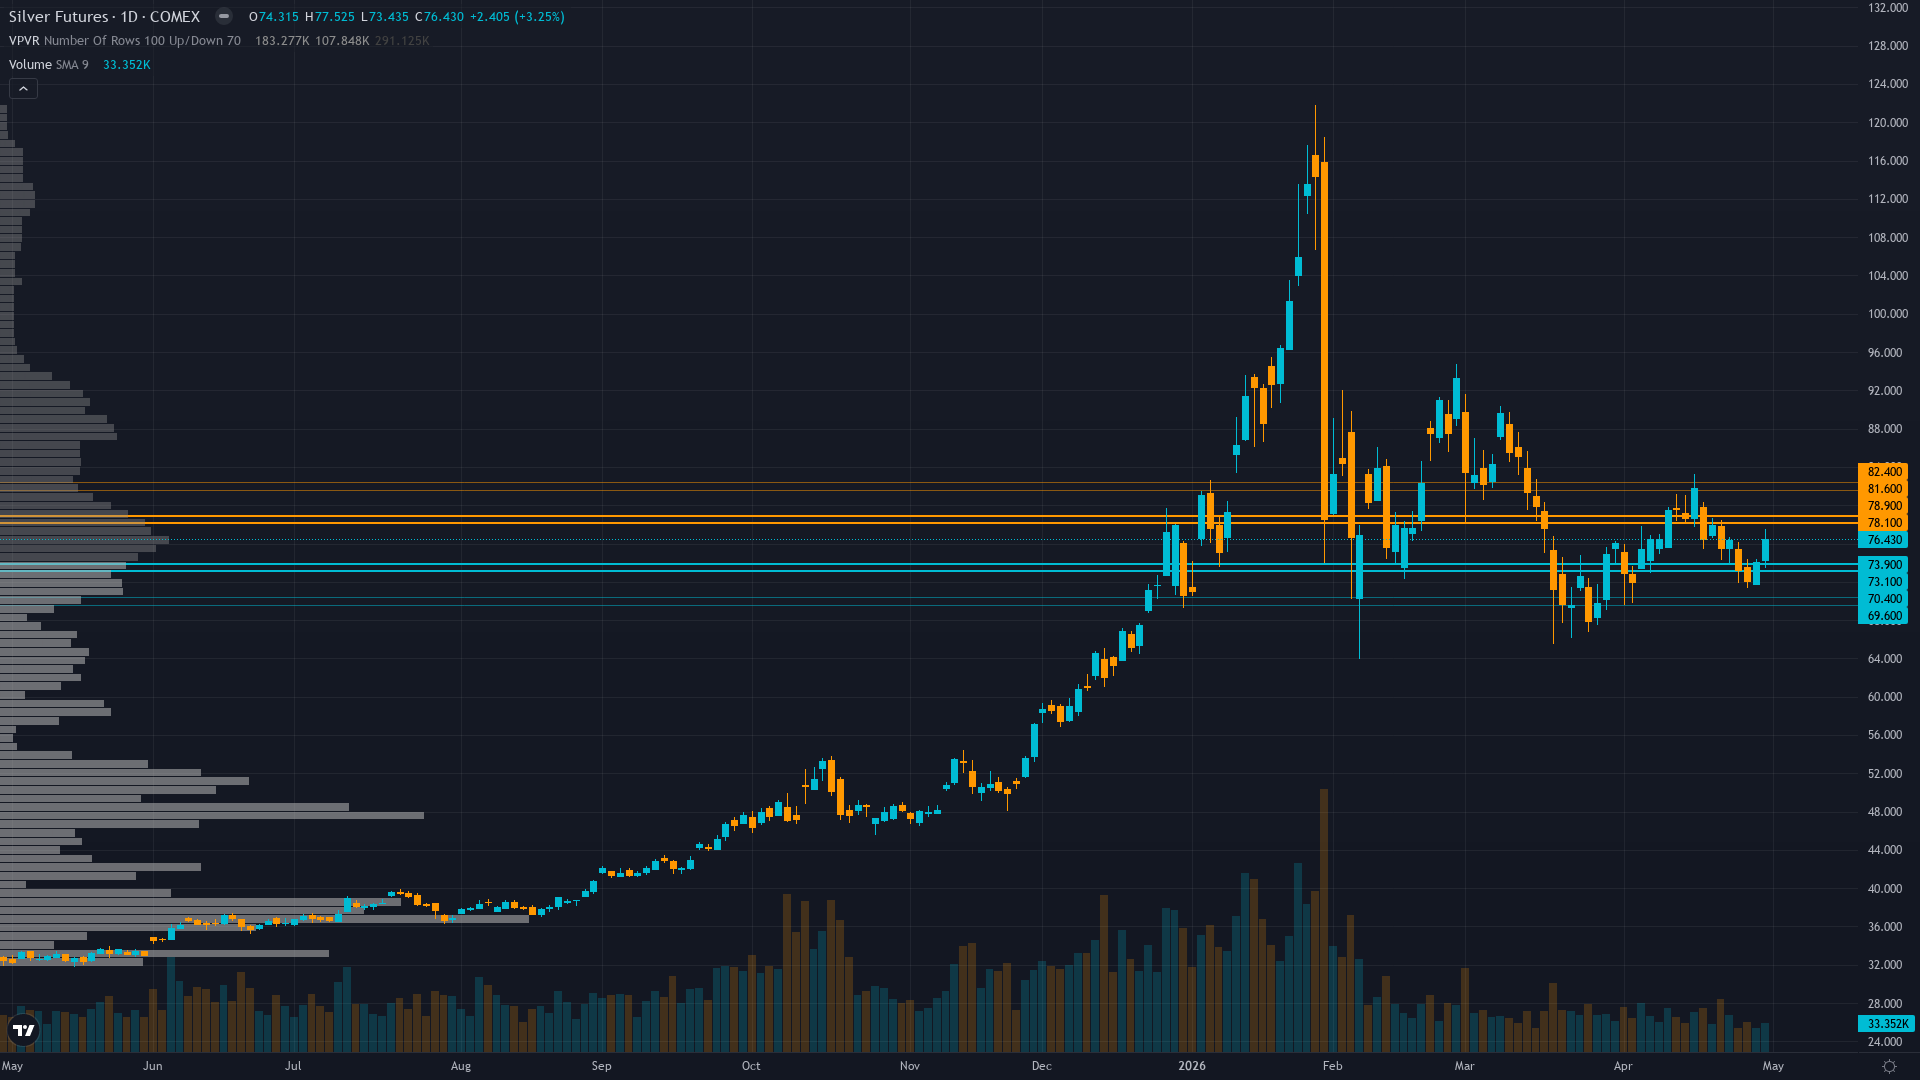
Trading at 76 with a 1.00% uptick, silver is drifting higher without strong conviction.
Managed money net long at 10,039 contracts (down 777 contracts week-over-week per May 1 COT) representing mid-range positioning after January-March washout, SLV outflows continuing at 9.32% AUM decline but decelerating, positioning neither extreme long nor capitulation short
Consensus vs MAD View
Market consensus: Market consensus fractured between structural bulls targeting $80-90 recovery on intact sixth-year deficit fundamentals and cautious neutrals awaiting May 12 CPI and June FOMC clarity, with CoinCodex algorithm predicting +1.96% to $76.89 by May 8 suggesting modest bullish lean emerging among technical models
Primary driver: Structural deficit fundamentals (sixth consecutive year with 67M oz shortfall and 59% industrial demand) remain intact but overwhelmed near-term by monetary policy headwinds from Fed's hawkish hold at 3.50-3.75% sustaining real yields above 2.0% and DXY strength
Where the Crowd May Be Wrong
Desk neutral stance ahead of binary May 12 CPI catalyst aligns with market's mixed positioning and uncertainty, though desk sees April 16 industrial demand deterioration (fabrication down 3% to four-year low) as more significant fundamental headwind contradicting structural deficit thesis than consensus fear-driven models recognize, creating mild divergence on demand elasticity assessment at $75+ price levels but directional alignment on near-term caution
Crowd Psychology
Neither side has committed heavily to silver futures, leaving sentiment in a neutral zone that offers little directional guidance on its own.
Options Flow
Implied volatility elevated at 49% (Barchart May 2026 contract data) well above normal 15-25% range reflecting continued two-way risk, put/call ratio and strike-level data insufficient for directional assessment per Options Agent, extreme volatility creates 5-7% daily ranges requiring wider risk management
The Bottom Line on Positioning
The positioning mosaic for SI futures combines neutral sentiment with stable from peak volatility conditions. Trend strength sits at 5/10, reflecting moderate directional pressure without clear dominance. Taken together, institutional behaviour, crowd psychology, and derivatives data frame the setup heading into the new week.
This analysis covers one dimension. Our full weekly report combines six specialist agents into a single actionable briefing with directional bias, key levels, and risk-opportunity matrix.
Start Free — Get the Market of the WeekFree weekly report · No credit card · Upgrade anytime


