Copper Forecast This Week — Outlook, Drivers & Key Levels
This week's Copper outlook: key drivers, volatility context, risk-opportunity assessment and the week ahead.

This Week's Starting Point
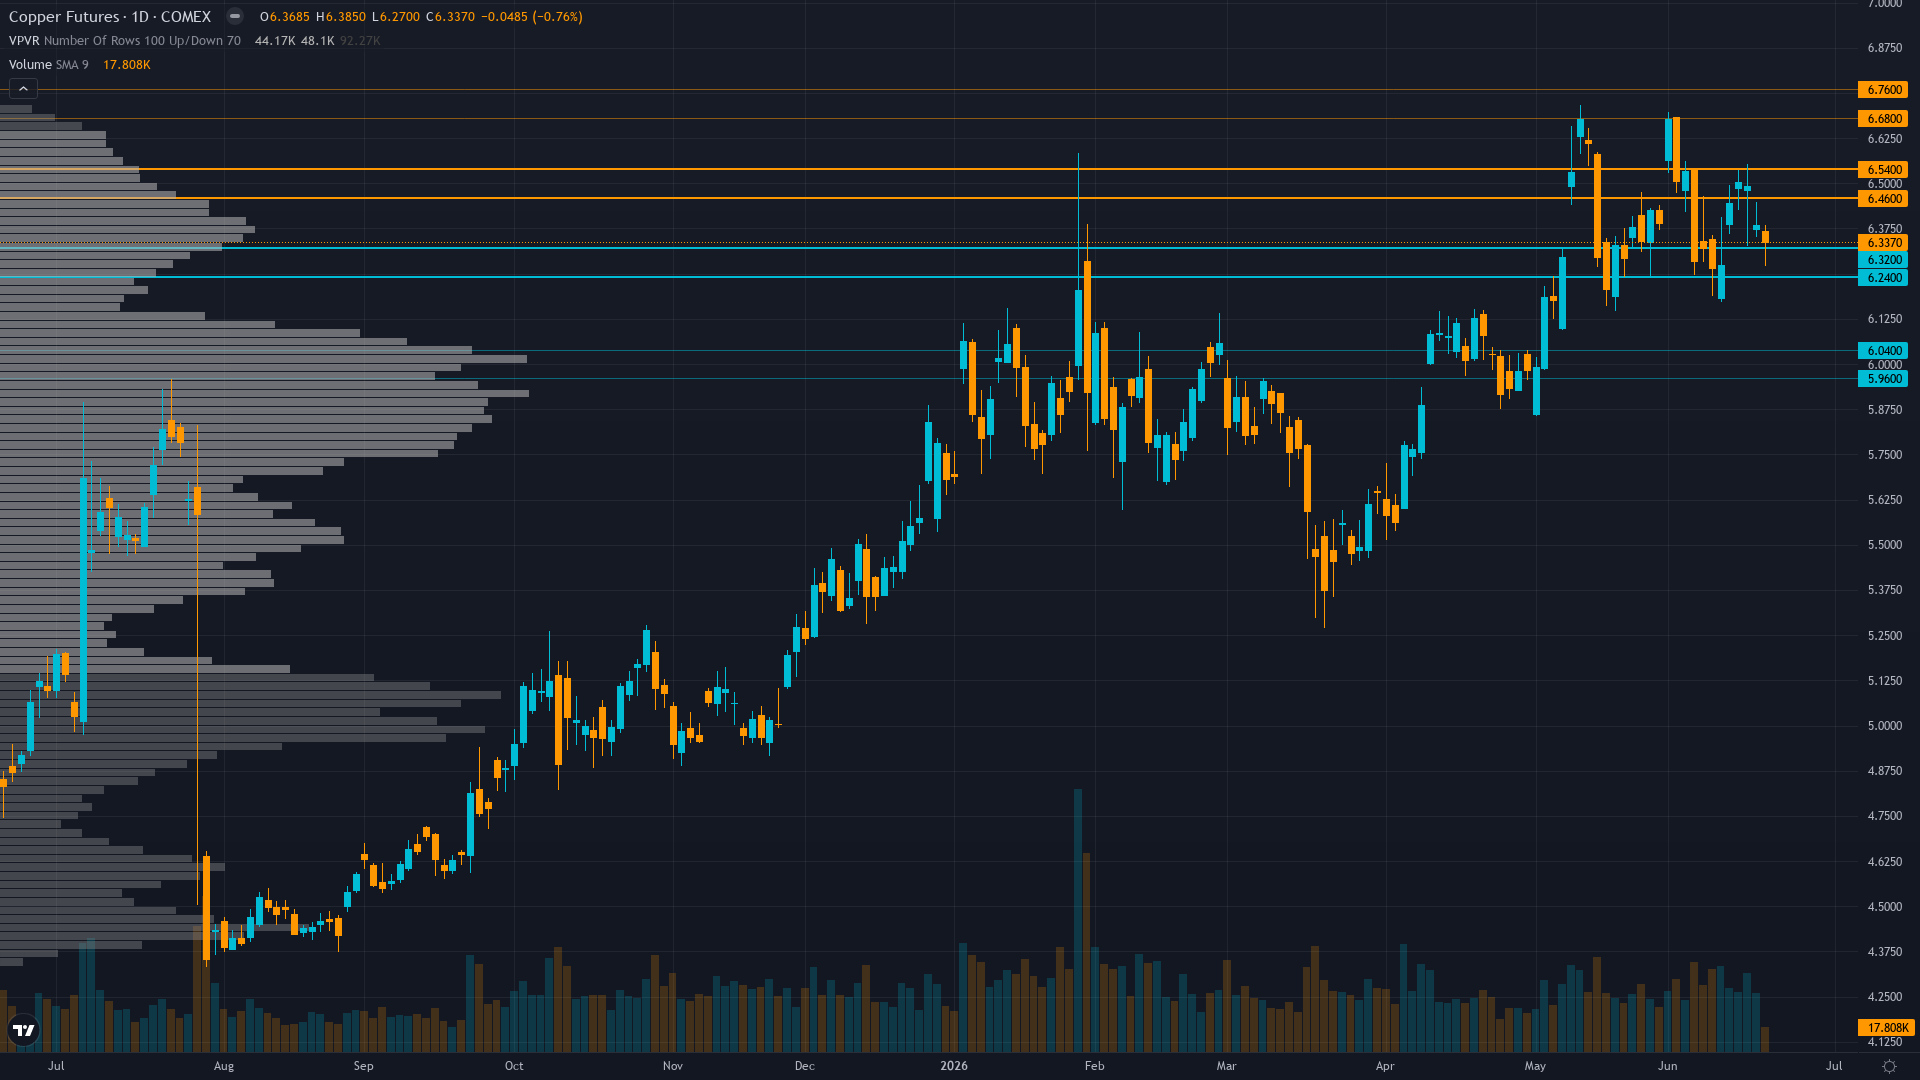
Trading at 6.34 with a 0.76% dip, copper is giving back ground gradually. Price action in copper futures has compressed into a consolidation pattern, typically a precursor to a directional breakout.
Copper consolidating from January 2026 record highs with elevated prices expected but near-term volatility increasing as market balances structural supply deficit fundamentals (Grasberg offline, LME inventory tight at 361,600t) against China demand deceleration (PMI 51.80 down from 52.20) and managed money positioning at 5-year high creating tactical uncertainty
Forces in Play
Primary driver: Miss Reset Rule triggered after 3 consecutive MISSED calls (Jun 19 NO CALL, Jun 12 BEARISH, Jun 5 BULLISH) requiring mandatory NEUTRAL stance per Section 7 Rule 5 integrity constraint, overriding all discipline signals and fundamental-technical conflicts
Secondary factor: Disciplinary schism persists with Fundamental +3.5/8 BULLISH on structural deficit (LME 361,600t critically low, 150k-600k tonne projected deficit) conflicting with Institutional -1.5/7 BEARISH on managed money at 5-year high positioning (71k contracts June 9) creating analytical paralysis
Additional influence: Fed hawkish pivot June 17 removing cut bias represents fresh macro headwind while China PMI decelerated to 51.80 in May from 52.20 April showing manufacturing momentum loss, price consolidating $6.34 in $6.28-6.50 range awaiting June 29 China PMI catalyst
Economic backdrop: Fed held June 16-17 with hawkish language shift removing cut bias and signaling potential hikes (Chair Warsh pivot) strengthening USD as commodity headwind, China PMI decelerated to 51.80 May from 52.20 April showing manufacturing momentum loss, VIX 16.78 confirming TRANSITIONAL regime
Fundamental assessment: Structural supply deficit intact with LME 361,600 tonnes (June 15) near multi-year lows and ICSG/Goldman projecting 150k-600k tonne deficit while Grasberg offline through Q2 2026 and sulfuric acid export ban affecting 15% global mining, but measured reliability shows Fundamental discipline only 50% accurate in COMMODITY class limiting conviction despite bullish thesis
Technical Landscape
Daily trend sideways-consolidating at $6.34 below 50-day MA zone but above 200-day structure, RSI 68.5 upper-neutral momentum without overbought extremes, 52-week range $4.33-$6.72 places current at 84th percentile leaving 6% upside to January highs versus 7% downside to $6.00 psychological support
Trend strength sits at 5/10, reflecting moderate directional pressure without clear dominance.
Risk-Reward Assessment
Primary risk: China June PMI (released June 29) disappointing below 50 expansion threshold confirming May deceleration from 52.20 to 51.80 represents structural demand deterioration not temporary weakness, validating that managed money positioning at 5-year high 71k contracts creates cascading liquidation risk triggering breakdown toward $6.00-6.15 support despite unchanged Grasberg supply fundamentals (Probability: medium)
Primary opportunity: June 29 China PMI surprise above 51.5 validating manufacturing resilience while June 30 Commerce tariff confirmation at 25%+ per Goldman forecast triggers hoarding incentive and domestic supply tightness, driving breakout through $6.50 resistance toward January $6.72 highs as structural deficit narrative reasserts dominance over near-term positioning concerns (Timeframe: 1-3 weeks as June 29 China PMI and June 30 Commerce tariff review create binary catalyst windows, though current analytical paralysis from three consecutive misses requires reset period before directional conviction warranted)
This week's edge: Resetting after 3 consecutive misses — thesis under review. Market experiencing analytical paralysis from fundamental-technical-positioning three-way schism requires stepping aside until June 29 China PMI or June 30 Commerce tariff catalyst resolves directional ambiguity. Measured discipline reliability (Fundamental 50%, Sentiment 56%, Economic 55%, Institutional 55% in COMMODITY class) suggests default category weightings may misallocate analytical capital.
Risk Environment
With vol at the 72th percentile, copper price is trading in an elevated regime where daily ranges can surprise even experienced traders. Volatility is expanding, with realised vol rising across timeframes. This typically signals increasing uncertainty and wider daily ranges ahead.
Current 35.2% short-term volatility suggests daily ranges of 3-4% versus normal 1.5-2% for copper, June consolidation showing deceleration as price approaches $6.50 resistance with declining volume indicating exhaustion not acceleration, inverted vol structure plus institutional positioning at 5-year high creates binary catalyst setup where June 29 China PMI likely triggers 5-7% directional move resolving current $6.28-6.50 range
Seasonal Context
Historical seasonal patterns for COMEX copper offer no strong directional signal in June 2026 (50% win rate). Mid-year demand plateau.
Week Ahead Outlook
The next major catalyst is China June Manufacturing PMI release (typically 21:00 EDT end-month) representing critical demand validation for world's 50% copper consumer after May deceleration to 51.80 from April 52.20, with threshold at 50 determining expansion versus contraction on Monday 29 June — a high-impact event that could materially shift the directional picture.
For copper, the balance between existing momentum and scheduled risk events sets the stage for the week ahead.
This analysis covers one dimension. Our full weekly report combines six specialist agents into a single actionable briefing with directional bias, key levels, and risk-opportunity matrix.
Start Free — Get the Market of the WeekFree weekly report · No credit card · Upgrade anytime


