Copper Forecast This Week — Outlook, Drivers & Key Levels
This week's Copper outlook: key drivers, volatility context, risk-opportunity assessment and the week ahead.

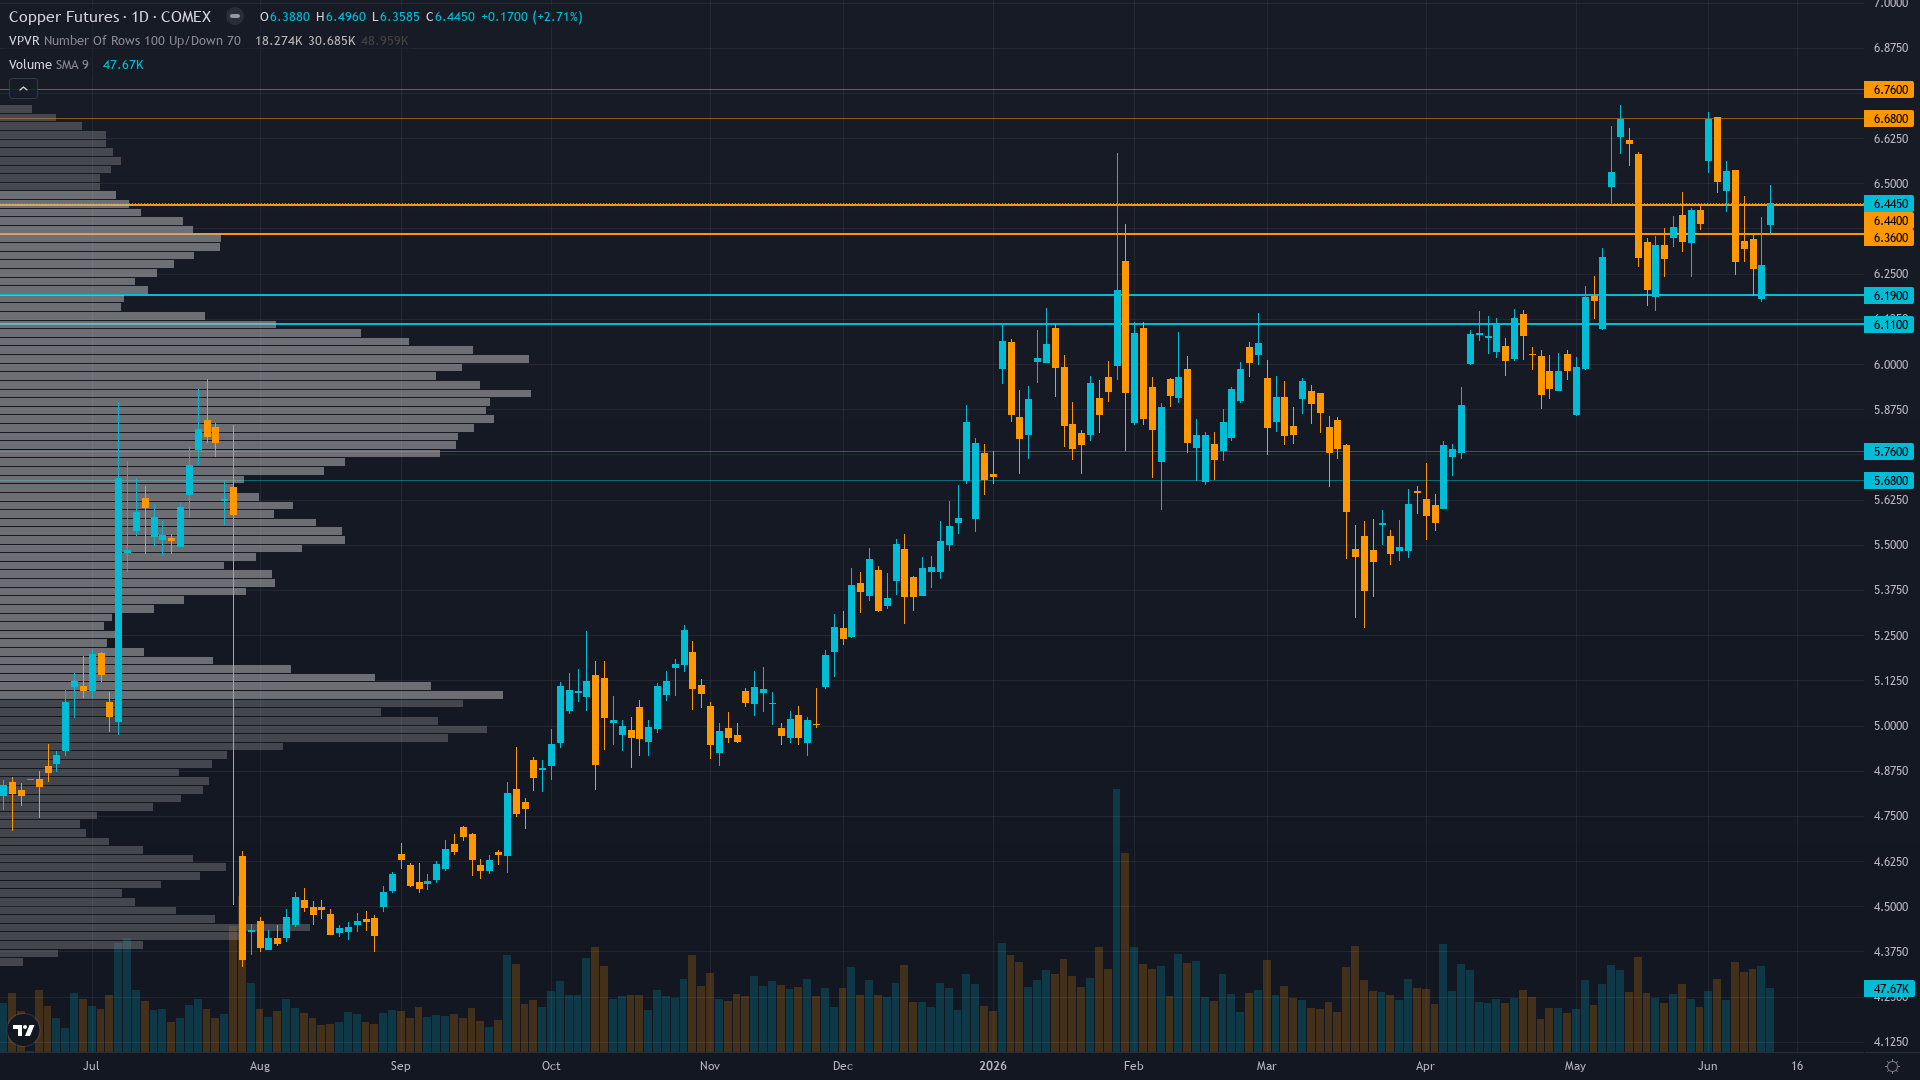
Current Market Picture
copper pushed to 6.45 on a 2.79% advance, reflecting sustained demand across the session. The market in copper futures is coiling, with narrowing price ranges suggesting stored energy that will eventually release.
Copper consolidating from January 2026 record highs with elevated prices expected but near-term volatility increasing as market balances structural supply deficit fundamentals (Grasberg offline, LME inventory tight at 367,300t) against China demand mixed signals (PMI 50.0 barely expansionary), managed money positioning at 5-year high creating crowding risk, and June 16-17 FOMC plus June 30 tariff catalysts creating binary outcome uncertainty
Key Drivers This Week
Primary driver: Disciplinary schism: Fundamental agent +3.5/8 bullish on structural supply deficit (Grasberg offline, LME inventory 367,300t) conflicts with Institutional agent -2.5/7 bearish contrarian signal on managed money positioning at 5-year high (71,974 contracts June 2) creating analytical paralysis despite price recovering to $6.45 from June 7 breakdown low of $6.28
Secondary factor: FOMC meeting June 16-17 represents imminent binary catalyst with 99% market pricing for hold but inflation at 4.2% versus Fed dual mandate creates policy uncertainty, while June 30 Commerce Department tariff review remains the critical structural catalyst that could shift copper from current consolidation into directional move
Additional influence: Technical recovery from June 6-7 breakdown ($6.54 to $6.28) has price at $6.45 reclaiming $6.40 resistance level but failing to decisively break above $6.50, while RSI likely in neutral-oversold 45-55 range suggests exhaustion of near-term directional momentum creating range-bound expectation
Economic backdrop: Fed on hold with June 16-17 FOMC meeting 99% priced for no change per Polymarket, inflation at 4.2% versus Fed dual mandate creates policy uncertainty, China PMI at 50.0 (June 1 release, now 13 days old) barely expansionary at expansion/contraction threshold, US ISM Manufacturing at 54.0 (June 1) solid expansion but data staleness limits conviction, VIX 19.44 below 20 confirming TRANSITIONAL regime
Fundamental assessment: Structural supply deficit intact with LME inventories critically low at 367,300 tonnes (June 11, down from prior highs), Grasberg offline through Q2 2026 removing 525k-600k tons, and China sulfuric acid export ban affecting 15% global mining, yet China NEV sector demand at 1.84M tonnes 2026 validates consumption floor despite Q4 2025 -8% YoY import weakness creating fundamental-demand tension
Price Structure
Daily trend corrective after June 6-7 breakdown but recovering with price at $6.45 reclaiming $6.40 level, trading above 50-day MA (~$5.85-5.90) and 200-day MA (~$5.25-5.35) maintaining bull market structure, 52-week range $4.33-$6.72 places current at 86th percentile leaving 4% upside to January highs versus 7% downside to $6.00 psychological support
Trend strength at 5/10 paints a picture of a market with some direction but lacking strong conviction.
Upside & Downside
Primary risk: Managed money positioning at 71,974 contracts (5-year high per June 2 COT) creates forced liquidation risk if June 16-17 FOMC delivers unexpectedly hawkish guidance strengthening dollar or if China June PMI (released June 29) disappoints below 50 threshold confirming Q1-Q2 import weakness represents structural demand deterioration, triggering cascade selling toward $6.00-$6.15 support as crowded positioning unwinds (Probability: medium)
Primary opportunity: June 30 Commerce tariff confirmation at 25%+ per Goldman forecast validates hoarding incentive and domestic supply tightness creating asymmetric upside setup toward $6.72 January highs, while China June PMI surprise above 50.5 confirming manufacturing resilience offsets current demand uncertainty, driving breakout through $6.50 psychological resistance as structural deficit reality forces market repricing from current consolidation (Timeframe: 2-4 weeks as June 16-17 FOMC and June 29 China PMI create binary catalyst windows, though technical damage from June 6-7 breakdown requires $6.50 decisive break to validate continuation case versus breakdown acceleration toward $6.00-6.15 major support representing further 6-7% decline potential)
This week's edge: Market experiencing analytical paralysis from June 6-7 breakdown recovery creating fundamental-technical-positioning three-way schism where desk at conviction floor of 5 acknowledges |signal| 0.2 below Min Signal 1.0 threshold prevents directional call per Section 7 Rule 2, requiring NEUTRAL stance until June 16-17 FOMC or June 29 China PMI resolves whether structural deficit or demand destruction narrative dominates near-term price action with $6.50 resistance and $6.28 support defining consolidation range
Volatility Context
At the 72th percentile of its 90-day range, copper price volatility is running hot, creating both opportunity and risk for directional traders. Realised vol is trending higher across the curve, which tends to accompany transitional periods where the market is repricing risk.
Current 35.2% short-term volatility suggests daily ranges of 3-4% versus normal 1.5-2% for copper, June 6-7 breakdown recovery showing deceleration as price approaches $6.50 resistance with declining volume indicating exhaustion not acceleration, inverted vol structure plus institutional positioning at 5-year high creates binary catalyst setup where June 16-17 FOMC or June 29 China PMI likely triggers 5-7% directional move resolving current $6.28-6.50 consolidation range
Seasonal Patterns
Seasonality is a non-factor for COMEX copper this month, with a 50% historical win rate offering no edge. Mid-year demand plateau.
Looking Forward
All eyes turn to FOMC decision June 16-17 (99% priced for hold but dot plot and policy statement could shift dollar trajectory creating commodity headwind/tailwind) with June 30 Commerce Department tariff review as critical secondary catalyst potentially triggering major directional resolution for copper market structure on Wednesday 17 June, which carries enough weight to force a decisive directional move.
The week ahead for copper price hinges on whether the prevailing consolidating regime can absorb the scheduled catalysts without a regime shift.
This analysis covers one dimension. Our full weekly report combines six specialist agents into a single actionable briefing with directional bias, key levels, and risk-opportunity matrix.
Start Free — Get the Market of the WeekFree weekly report · No credit card · Upgrade anytime