Copper Forecast This Week — Outlook, Drivers & Key Levels
This week's Copper outlook: key drivers, volatility context, risk-opportunity assessment and the week ahead.

Market Overview
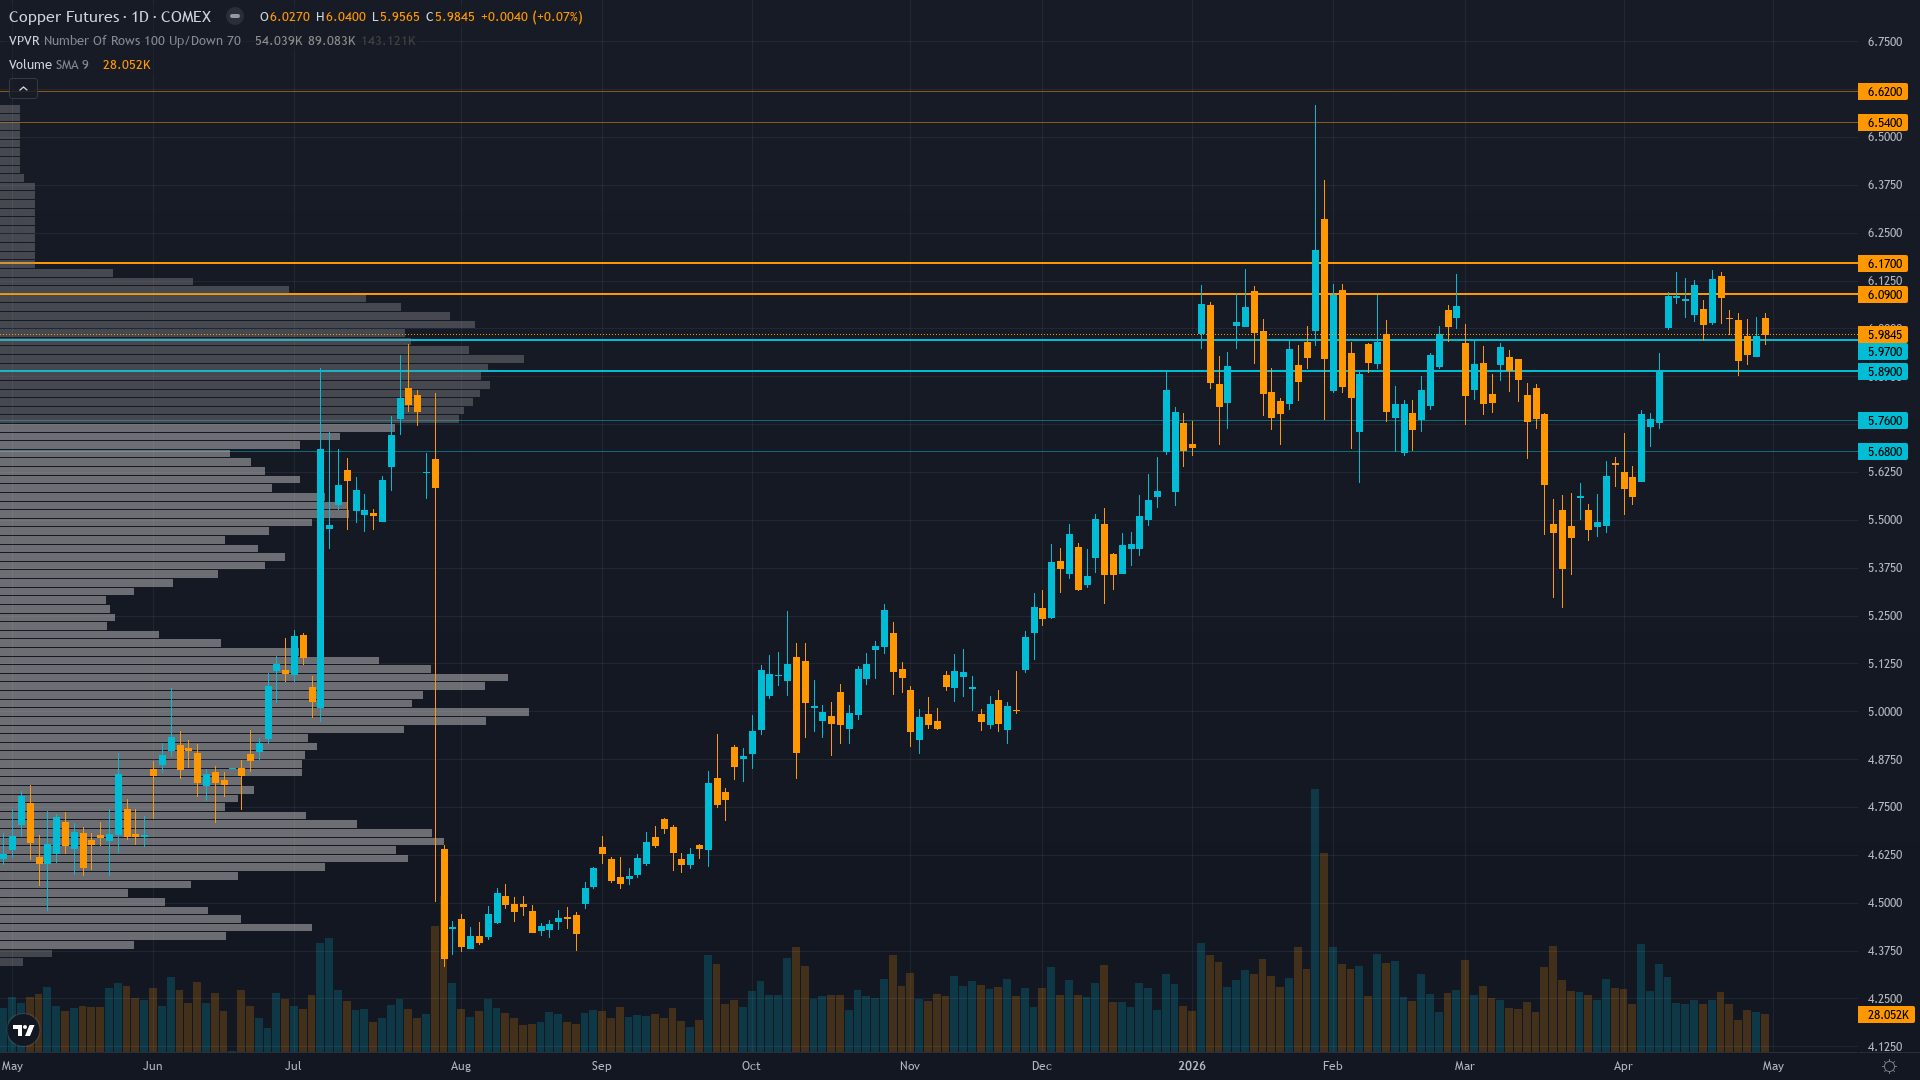
Trading at 6.01 with a 0.67% uptick, copper is drifting higher without strong conviction. copper futures is range-bound and tightening, with decreasing volatility signalling a directional resolution ahead.
Copper consolidating from January 2026 record highs with elevated prices expected to persist but near-term volatility likely as market balances supply deficit fundamentals against China demand mixed signals and elevated inventory levels
This Week's Catalysts & Drivers
Primary driver: China April Caixin Manufacturing PMI surged to 52.2 (vs 51.0 expected, released April 30) representing a material positive surprise signaling manufacturing expansion acceleration, the critical demand driver for copper as world's 50% consumer
Secondary factor: Structural supply deficit intact with Grasberg mine offline through Q2 2026 removing 525,000-600,000 tons, creating acute physical shortage despite near-term inventory builds and demand mixed signals
Additional influence: VIX at 16.89 below 20 threshold and DXY weakening to 98.22 creating RISK-ON macro regime supportive of cyclical commodities, though copper-specific fundamentals show divergence between supply tightness and demand uncertainty
Economic backdrop: Fed on hold with no rate cuts until late 2026, China April PMI 52.2 strongest expansion validating manufacturing demand floor, VIX 16.89 below 20 threshold confirming RISK-ON conditions, DXY 98.22 down 1.8% month-over-month removing commodity headwind
Fundamental assessment: Supply deficit materializing with Grasberg offline, China sulfuric acid export ban affecting 15% of global mining, but demand side showing bifurcation with LME inventories at 8-year highs contradicting available inventory tightness creating analytical tension
Technical Picture
Daily uptrend intact above 50-day and 200-day moving averages with RSI 68-70 showing positive momentum without overbought extremes, price consolidating 9% below January $6.58 52-week high at 72nd percentile of annual range
At 6/10, trend strength indicates a solid directional lean without being overextended.
Bull & Bear Case
Primary risk: China April credit data disappointing or property sector deterioration accelerating despite manufacturing PMI strength, validating that import weakness in prior periods represents structural demand destruction rather than logistics noise, triggering extended profit-taking from elevated 29% year-over-year price levels (Probability: medium)
Primary opportunity: April 30 China PMI upside surprise (52.2 vs 51.0) validating manufacturing resilience combines with May-June seasonal construction restocking demand and Grasberg supply shock persisting through Q2 2026, driving breakout through $6.13 psychological resistance toward January $6.58 highs as deficit reality forces market repricing (Timeframe: 2-6 weeks as May seasonal tailwinds materialize, mid-May China credit data validates manufacturing expansion translation to broader demand recovery, and available LME inventory tightness (89,725 tonnes) overrides headline stock levels)
This week's edge: Market may be overweighting April LME inventory 8-year high at 400,625 tonnes and prior quarter China import weakness while underweighting that April 30 China PMI surge to 52.2 (3-day old catalyst) represents FRESH manufacturing expansion validation not yet fully priced, available LME inventory excluding warrants critically tight at 89,725 tonnes contradicting headline stock levels, and Grasberg supply shock persisting through Q2 2026 creating asymmetric upside setup toward $6.13-6.58 resistance as May seasonal construction restocking materializes
Volatility Regime
Volatility for copper price is at the 65th percentile over 90 days — a normal regime that allows for standard position sizing and conventional trade management. The vol trend is flat, with no meaningful shift across timeframes. Stable vol environments often lull traders before a regime change arrives.
Current 28.5% short-term volatility (5-day) suggests daily ranges of 2-3% versus normal 1.5-2%, record high consolidation showing controlled price action rather than blow-off top characteristics with tightening ranges since mid-April indicating digestion phase nearing completion ahead of May 11-15 catalyst events, supply-driven rallies historically more sustainable than monetary-driven moves creating confidence in trend continuation potential
What History Shows
COMEX copper enters May 2026 without a meaningful seasonal lean (52% win rate). Demand stabilises at high levels.
The Week Ahead
China April credit and lending data release (typically mid-May) plus US ISM Manufacturing PMI for April on Monday 11 May is a high-impact catalyst with the potential to redefine the near-term outlook entirely.
How copper futures navigates the confluence of consolidating conditions and incoming data will determine whether the current directional thesis holds or breaks.
This analysis covers one dimension. Our full weekly report combines six specialist agents into a single actionable briefing with directional bias, key levels, and risk-opportunity matrix.
Start Free — Get the Market of the WeekFree weekly report · No credit card · Upgrade anytime


