Copper Forecast This Week — Outlook, Drivers & Key Levels
This week's Copper outlook: key drivers, volatility context, risk-opportunity assessment and the week ahead.

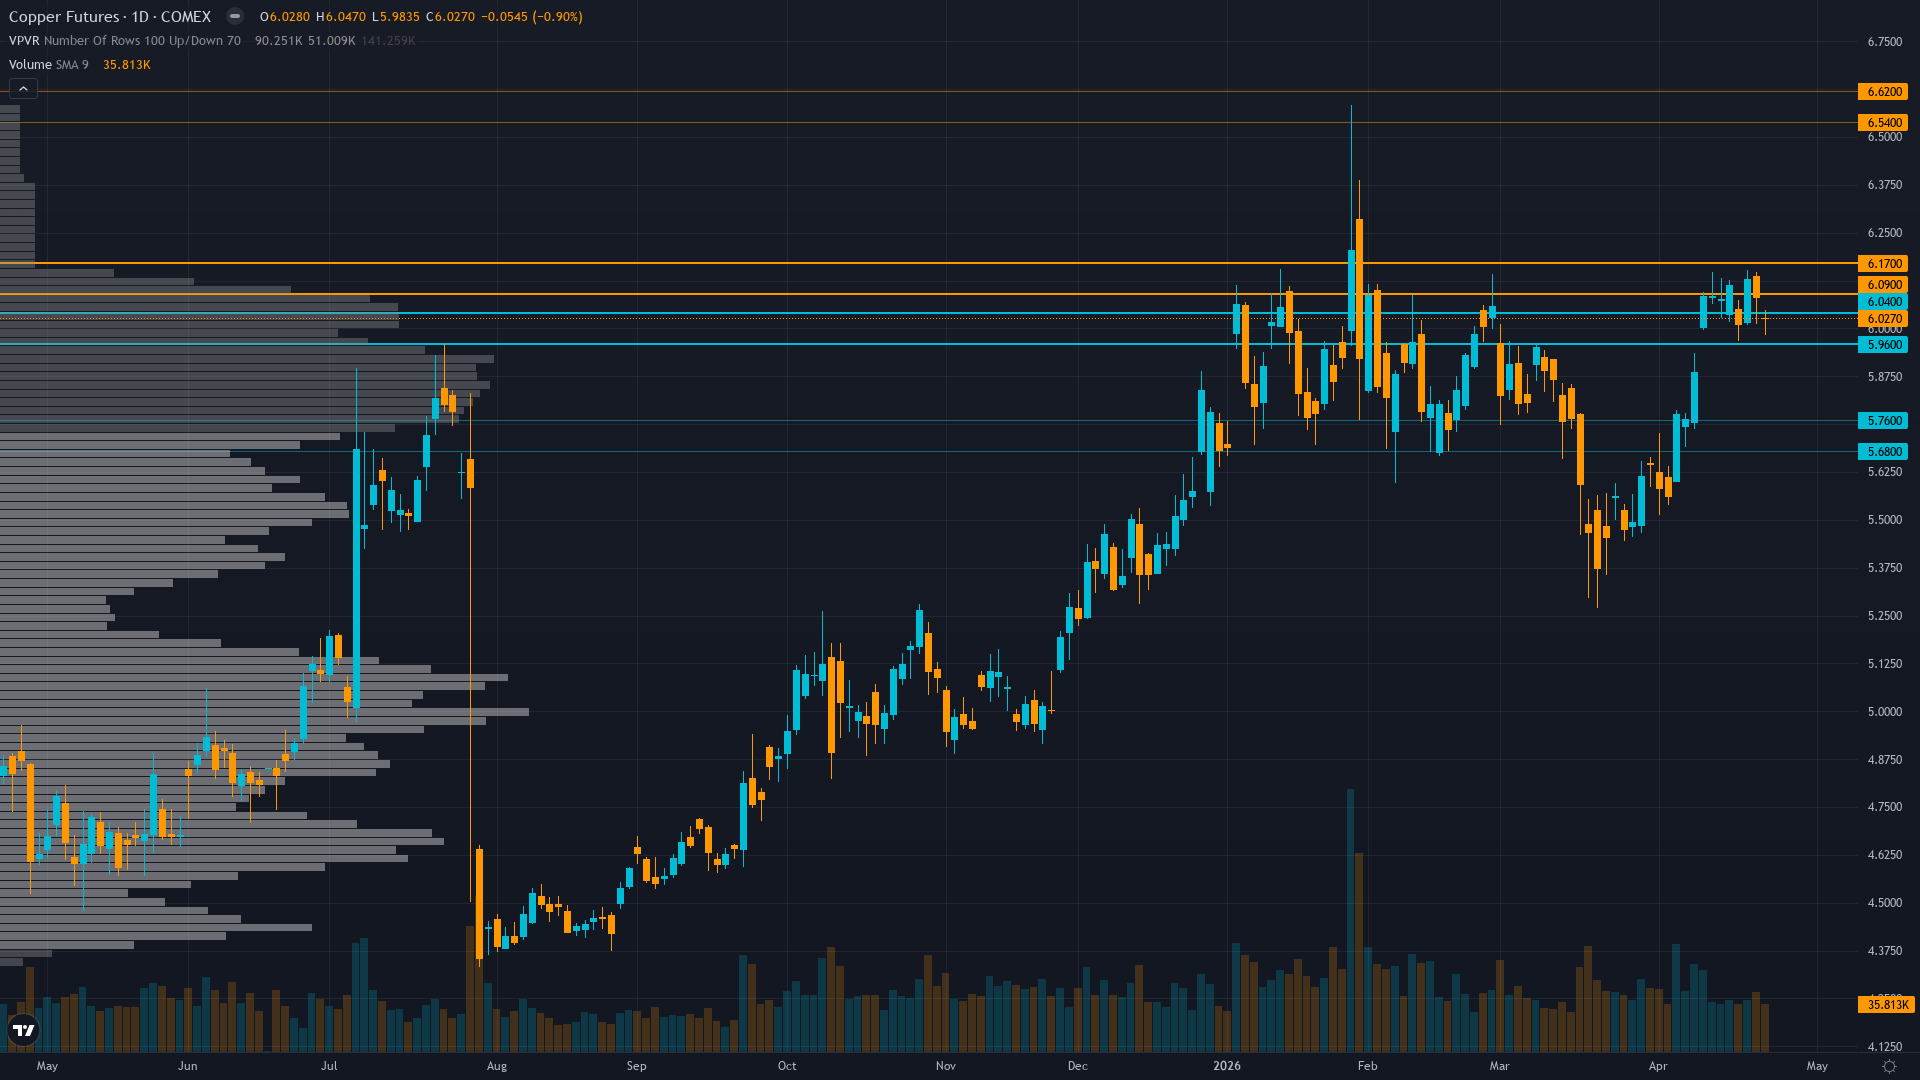
Where Things Stand
At 6.03, copper has eased 0.90% in a controlled retreat. copper futures is consolidating, with price compressing into a narrower range as the market builds energy for its next move.
Copper consolidating from January 2026 record highs with market split between mild surplus views (ICSG 96,000t) and severe surplus forecasts (Goldman 490,000t), expecting near-term volatility as China demand trajectory and global manufacturing momentum determine whether elevated prices justified by supply constraints or vulnerable to correction
What's Driving Price
Primary driver: ICSG April 25 revision to 96,000-tonne 2026 surplus (down from 150,000-tonne deficit forecast) creates fundamental narrative shift from deficit to surplus, though Goldman Sachs maintains 490,000-tonne surplus and $12,650/tonne average creating analytical tension between mild and severe oversupply views
Secondary factor: US S&P Global Manufacturing PMI surged to 54.0 in April (vs 52.5 consensus, released April 23) marking strongest expansion in 3+ years, providing genuine demand acceleration catalyst that partially offsets China PMI mixed signals (NBS 50.4 but new orders contractionary at 49.2)
Additional influence: Price consolidating around $6.00-6.03 psychological level from January 14 all-time high of $6.58, holding above 50-day MA with VIX at 19.50 creating neutral TRANSITIONAL macro regime as geopolitical risk premium (Iran tensions) faded per April 2 BNN Bloomberg confirmation
Economic backdrop: Fed on hold at 4.25-4.50% range with April 28-29 FOMC meeting expected to maintain status quo, US manufacturing PMI 54.0 strongest in 3+ years offsetting China PMI weakness, VIX 19.50 below 20 threshold indicating TRANSITIONAL regime with mild risk-on characteristics
Fundamental assessment: Critical divergence between ICSG's 96,000-tonne surplus forecast (April 25 revision, much smaller than feared) and Goldman's 490,000-tonne surplus creating analytical confusion, while LME inventories at 398,425 tonnes (down from 400,625t April 14-20 drawdown) and Grasberg supply shock persisting through Q2 2026 provide structural support floor
Chart Assessment
Daily uptrend intact above 50-day and 200-day MAs with RSI 68-70 showing positive momentum without overbought extremes, price consolidating 8% below January $6.58 52-week high at 72nd percentile of annual range creating controlled digestion pattern
With trend strength at 6/10, there's a clear directional tilt but room for the move to develop further.
Risk & Opportunity
Primary risk: China April PMI disappointing below 50 expansion threshold confirming March import weakness (-10.9% YoY) represents structural demand deterioration rather than temporary logistics, validating Goldman's 490,000-tonne surplus forecast and triggering extended profit-taking from elevated +23% YoY price levels as deficit narrative fully deflates (Probability: medium)
Primary opportunity: ICSG's April 25 revision to only 96,000-tonne surplus (vs Goldman's 490,000t) proving accurate as US manufacturing surge (PMI 54.0) and April-May seasonal strength (80% historical success rate into spring construction) drive demand recovery, with Grasberg supply shock persisting through Q2 2026 creating asymmetric upside toward $6.50-6.58 prior highs as market reprices away from severe surplus fears (Timeframe: 2-6 weeks as April 29 China PMI validates expansion resilience above 50, April-May seasonal tailwinds materialize into Northern Hemisphere spring construction restocking, and April 23 US PMI strength confirms broadening global manufacturing recovery beyond China dependency)
This week's edge: Market appears divided between two narratives that both emerged THIS WEEK: ICSG's April 25 revision to 96,000t surplus (much less bearish than feared, supportive) versus Goldman's April 21 maintained 490,000t surplus (severely bearish). Desk at conviction floor of 5 after recent MISSED call and Fundamental agent whipsaw suggests stepping aside until April 29 China PMI resolves demand trajectory—this is a low-information-edge environment where patience is the correct tactical response rather than forcing directional conviction on conflicting fresh data.
Volatility Backdrop
copper price volatility at the 65th percentile reflects a balanced environment where standard risk parameters apply. Volatility remains anchored at current levels, with no clear signal of an imminent regime shift in either direction.
Current 28.5% short-term volatility (5-day) suggests daily ranges of 2-3% versus normal 1.5-2%, record high consolidation showing controlled price action rather than blow-off top characteristics with tightening ranges since mid-April indicating digestion phase nearing completion ahead of April 29 catalyst event, but conflicting fundamental signals (ICSG mild surplus vs Goldman severe surplus) mean breakout direction remains binary
Historical Seasonal Bias
Seasonal analysis shows a historically bullish bias for COMEX copper in April 2026, with a 65% win rate. Peak demand season for industrial metals.
What to Watch
The Dual catalyst window: FOMC decision April 28-29 (policy unchanged expected) and China April PMI release April 29 representing critical demand validation for world's 50% copper consumer on Wednesday 29 April stands as the week's primary risk event — high-impact and capable of overriding the existing technical and sentiment setup.
The interplay between consolidating market conditions and upcoming catalysts will define this week's trading landscape for HG futures.
This analysis covers one dimension. Our full weekly report combines six specialist agents into a single actionable briefing with directional bias, key levels, and risk-opportunity matrix.
Start Free — Get the Market of the WeekFree weekly report · No credit card · Upgrade anytime


