Copper COT & Institutional Positioning — Smart Money Analysis
Copper institutional positioning: COT data, sentiment analysis and smart money flow assessment.

Where Institutions Stand
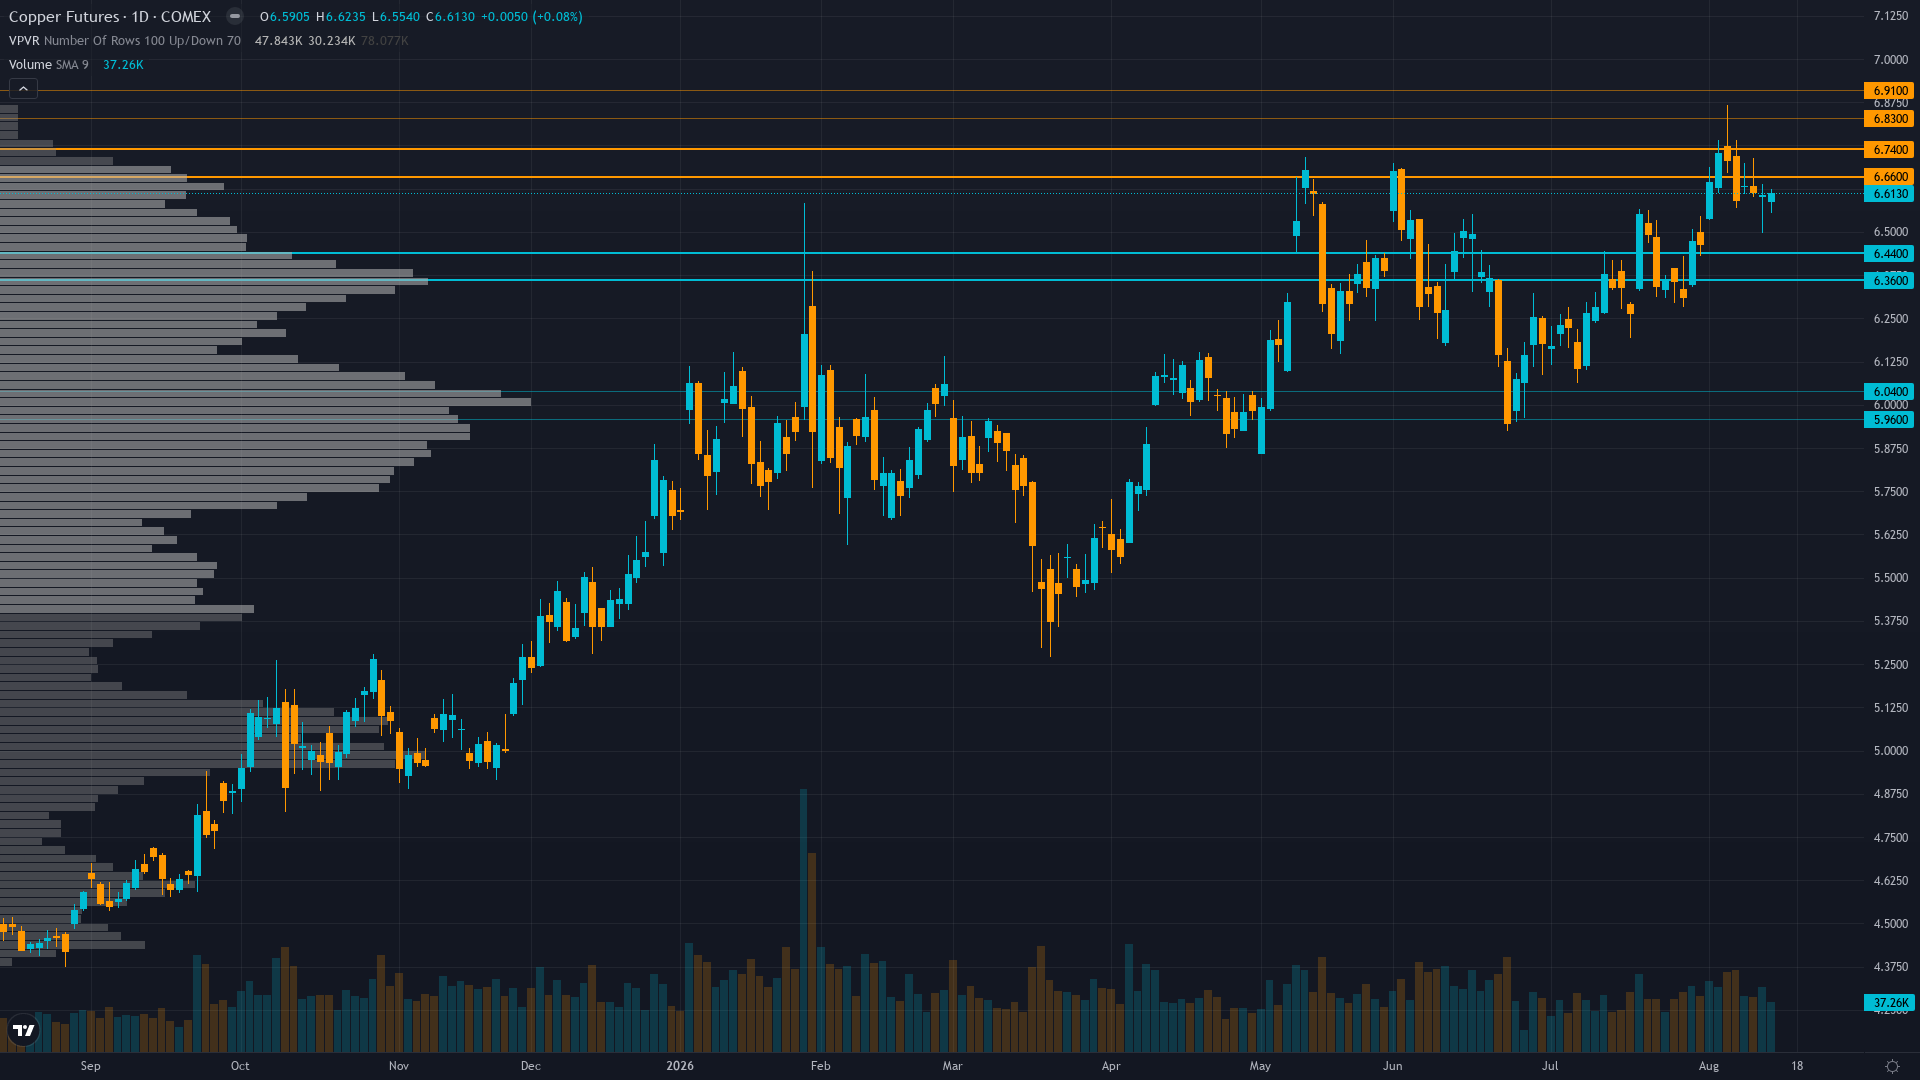
Trading at 6.5995 with a 0.05% dip, copper is giving back ground gradually.
Non-commercial net long at 80,388 contracts as of Aug 11, up 3,265 WoW, at 99.4th percentile of 3-year range representing extreme bullish speculative crowding with acute mean reversion risk if physical scarcity narrative falters
Consensus vs MAD View
Market consensus: Copper trading near record highs supported by structural supply deficit and AI/data center demand narrative, but extreme speculative positioning at 99.4th percentile COT and imminent China demand data create binary risk for August
Primary driver: Structural supply deficit intact with LME inventories at 204,975 tonnes and fresh supply disruptions (Indonesia Gresik smelter boiler failure Aug 11, DRC export bans, Chilean storm impacts) validating physical scarcity despite extreme speculative positioning at 99.4th percentile COT
Where the Crowd May Be Wrong
Desk's BULLISH bias aligns with market consensus but identifies fresh Gresik smelter supply disruption (Aug 11) and China Aug 17 data catalyst as under-weighted factors, creating mild divergence from pure mean-reversion narrative on extreme COT positioning alone
Crowd Psychology
Neither side has committed heavily to copper futures, leaving sentiment in a neutral zone that offers little directional guidance on its own.
Options Flow
Options IV at 28.7% vs 20-day realised vol of 20.7% indicating 7-8 vol points of variance risk premium, put/call volume ratio of 0.43 suggests call bias, but data is stale from early August limiting actionable insight
The Bottom Line on Positioning
The positioning mosaic for HG futures combines greed sentiment with stable volatility conditions. Trend strength registers at 7/10, suggesting meaningful but not extreme directional bias. Taken together, institutional behaviour, crowd psychology, and derivatives data frame the setup heading into the new week.
This analysis covers one dimension. Our full weekly report combines six specialist agents into a single actionable briefing with directional bias, key levels, and risk-opportunity matrix.
Start Free — Get the Market of the WeekFree weekly report · No credit card · Upgrade anytime