Russell 2000 Forecast This Week — Outlook, Drivers & Key Levels
This week's Russell 2000 outlook: key drivers, volatility context, risk-opportunity assessment and the week ahead.

Current Market Picture
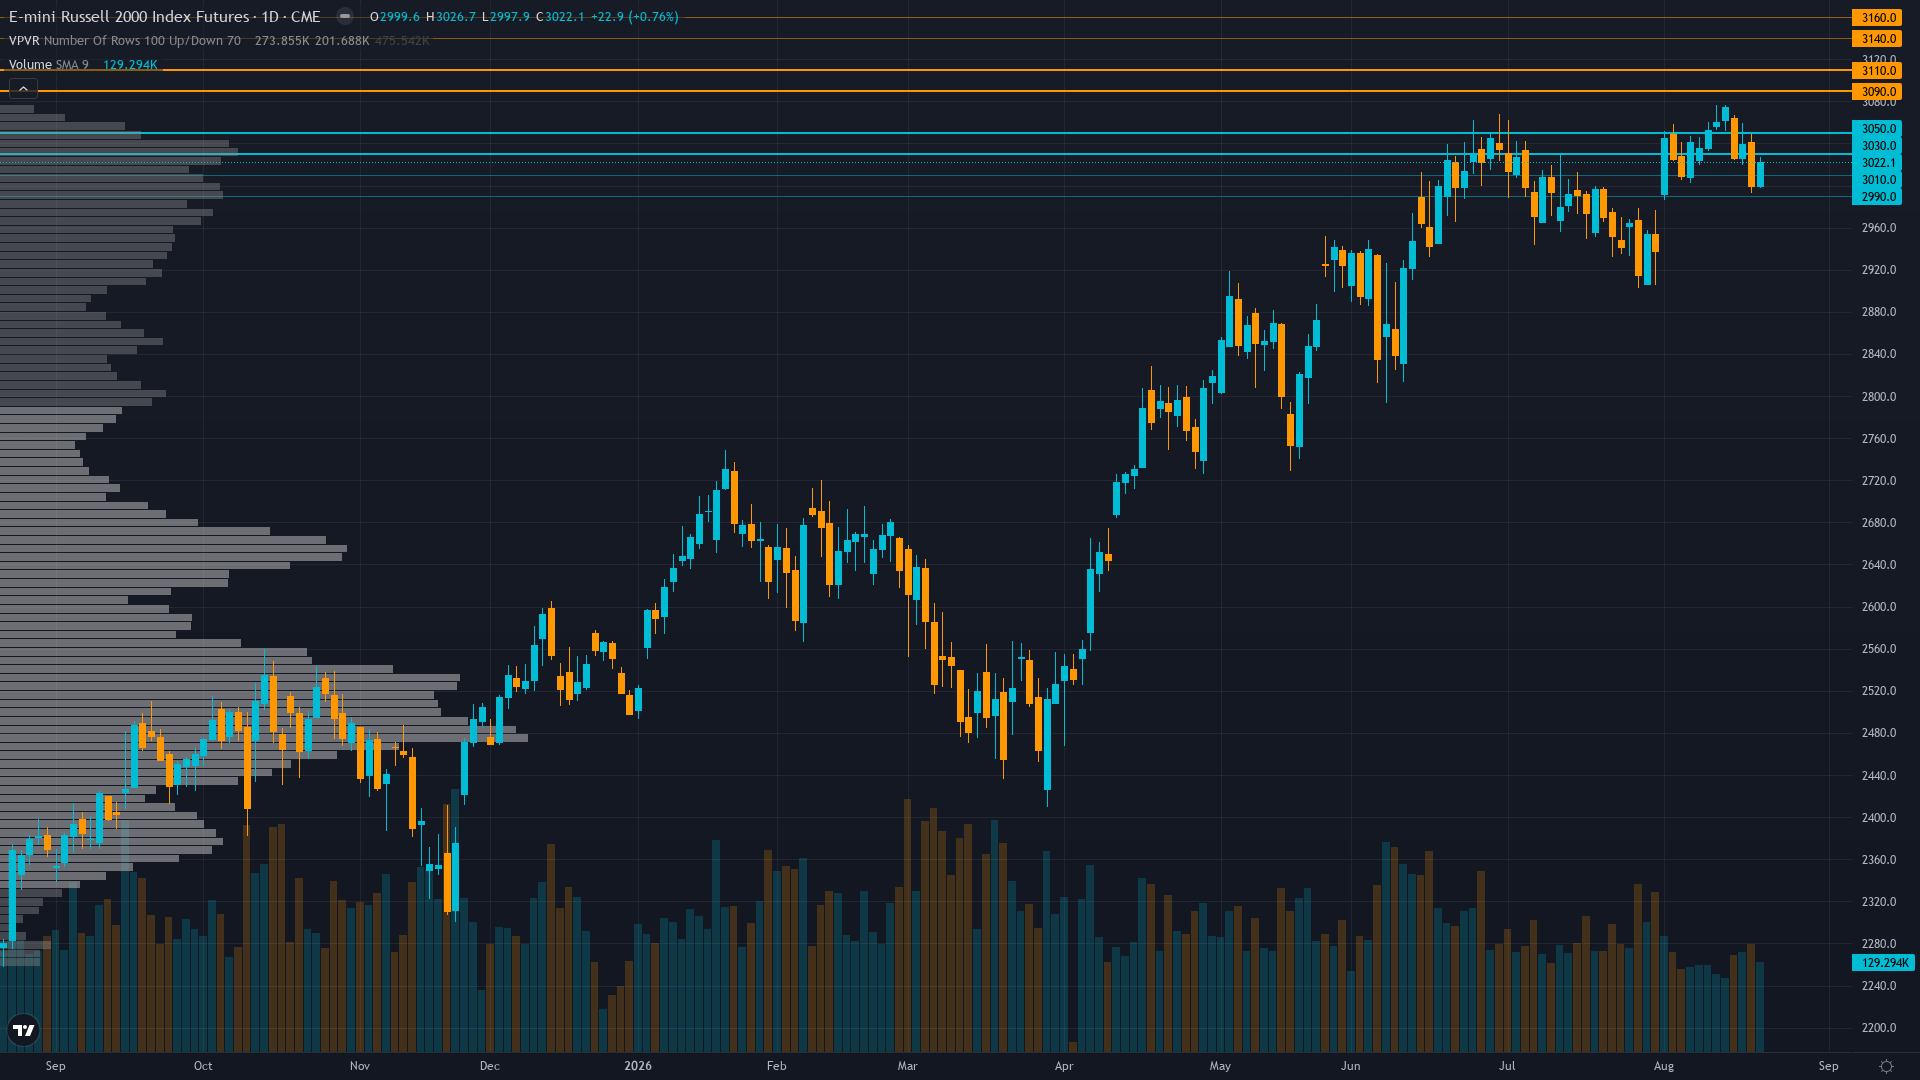
At 3022.1, Russell 2000 has inched 0.85% higher in a measured advance. The market in Russell 2000 futures is coiling, with narrowing price ranges suggesting stored energy that will eventually release.
Small-caps consolidating after pullback from all-time highs with market awaiting PCE data for directional clarity, maintaining cautious neutrality as August seasonality and oversold conditions create competing narratives
Key Drivers This Week
Primary driver: RTY pulled back -1.71% last week from the Aug 17 all-time high at 3074.9 to close at 3022.1, consolidating above the psychological 3000 support after the ATH breakout failed to sustain, with oversold RSI conditions at 33.73 and extreme speculative net short positioning (-42,215 contracts, 28.5th percentile) creating a coiled spring setup
Secondary factor: PCE Price Index release on Aug 26 (consensus 3.7% YoY, Core PCE MoM 0.2% est vs 0.1% prior) is the dominant near-term catalyst — a benign print supporting the disinflation narrative could trigger a short-covering bounce from oversold levels, while a hot print would reinforce small-cap floating-rate debt headwinds
Additional influence: Seasonal headwinds intensify as August historically shows only 48% win rate for RTY and the treacherous September-October period approaches, with summer months (May-August) showing significant slowdown for small-caps per QuantStrategy research, creating structural drag against any recovery attempt
Economic backdrop: RISK-ON macro regime with VIX at 15.15 below 20, HY credit spreads at 271bps tightening, Fed on hold at 3.63%, USD weakening (-2.26% MoM), and inflation at 2.34% near target — the macro environment supports risk assets, but benign conditions are already priced at near-record levels
Fundamental assessment: Forward P/E of 18.27 represents a 13% premium to the 20-year average of 16.19, suggesting modest overvaluation, though the 34.5% valuation discount to large caps (Russell 1000 at 29.3x) continues to support rotation narrative — earnings quality concerns persist with high-beta names outperforming quality
Price Structure
Price at 3022.1 consolidating 1.7% below Aug 17 ATH at 3074.9, well above 50-day (2492) and 200-day (2564) MAs, but RSI at 33.73 signals oversold conditions with potential for mean reversion bounce — the pullback is corrective within an intact bull trend rather than a trend reversal
Trend strength at 4/10 paints a picture of a market with some direction but lacking strong conviction.
Upside & Downside
Primary risk: Core PCE prints hotter than consensus 0.2% MoM, challenging the disinflation narrative and reinforcing small-cap credit headwinds from floating-rate debt burden, triggering a breakdown below 3000 psychological support toward 2937 major support, amplified by August-October seasonal weakness (Probability: medium)
Primary opportunity: Oversold bounce from RSI 33.73 triggered by a benign PCE print confirming disinflation, forcing short covering from the extreme -42,215 contract speculative net short position (28.5th percentile) with a retest of 3045.6-3074.9 resistance, supported by the 34.5% valuation discount to large caps and RISK-ON macro backdrop (Timeframe: 1-2 weeks through Aug 26 PCE catalyst resolution and into early September)
This week's edge: Below noise threshold — range-bound assessment. The extreme speculative net short positioning (-42,215 contracts, 28.5th percentile) combined with oversold RSI (33.73) creates a mechanical short-covering setup that may not be fully discounted by the market's current neutral positioning, but the Fundamental discipline's measured 55% reliability and bearish valuation view (P/E 18.27 vs 16.19 historical) prevents aggressive bullish conviction until PCE provides catalyst clarity
Volatility Context
At the 62th percentile, RTY futures volatility sits in a normal range, neither compressed enough to signal a breakout nor elevated enough to demand caution. Realised vol is holding its current level, suggesting the market has found a temporary equilibrium in its risk pricing.
Normal volatility regime at 62nd percentile with inverted term structure requires wider stop placement near 2937 major support, expect 40-60 point daily ranges expanding to 60-80 on Aug 26 PCE day, the inverted term structure signals near-term catalyst risk that makes directional pre-positioning unreliable until PCE provides clarity — range-trading between 3000-3050 with defined boundaries preferred
Seasonal Patterns
Seasonality is a non-factor for small-cap futures this month, with a 48% historical win rate offering no edge. Late summer low volume, high volatility risk.
Looking Forward
All eyes turn to July Core PCE Price Index MoM (consensus 0.2% vs prior 0.1%) and YoY (consensus 3.7% vs prior 3.7%) — the Fed's preferred inflation measure, critical for small-cap rate sensitivity given floating-rate debt exposure and the Fed hold at 3.63% on Wednesday 26 August, which carries enough weight to force a decisive directional move.
The week ahead for RTY futures hinges on whether the prevailing consolidating regime can absorb the scheduled catalysts without a regime shift.
This analysis covers one dimension. Our full weekly report combines six specialist agents into a single actionable briefing with directional bias, key levels, and risk-opportunity matrix.
Start Free — Get the Market of the WeekFree weekly report · No credit card · Upgrade anytime