AUD/USD Key Levels This Week — Support, Resistance & Confluence Zones
AUD/USD key levels breakdown: support zones, resistance zones, confluence and price structure.

Structural Assessment
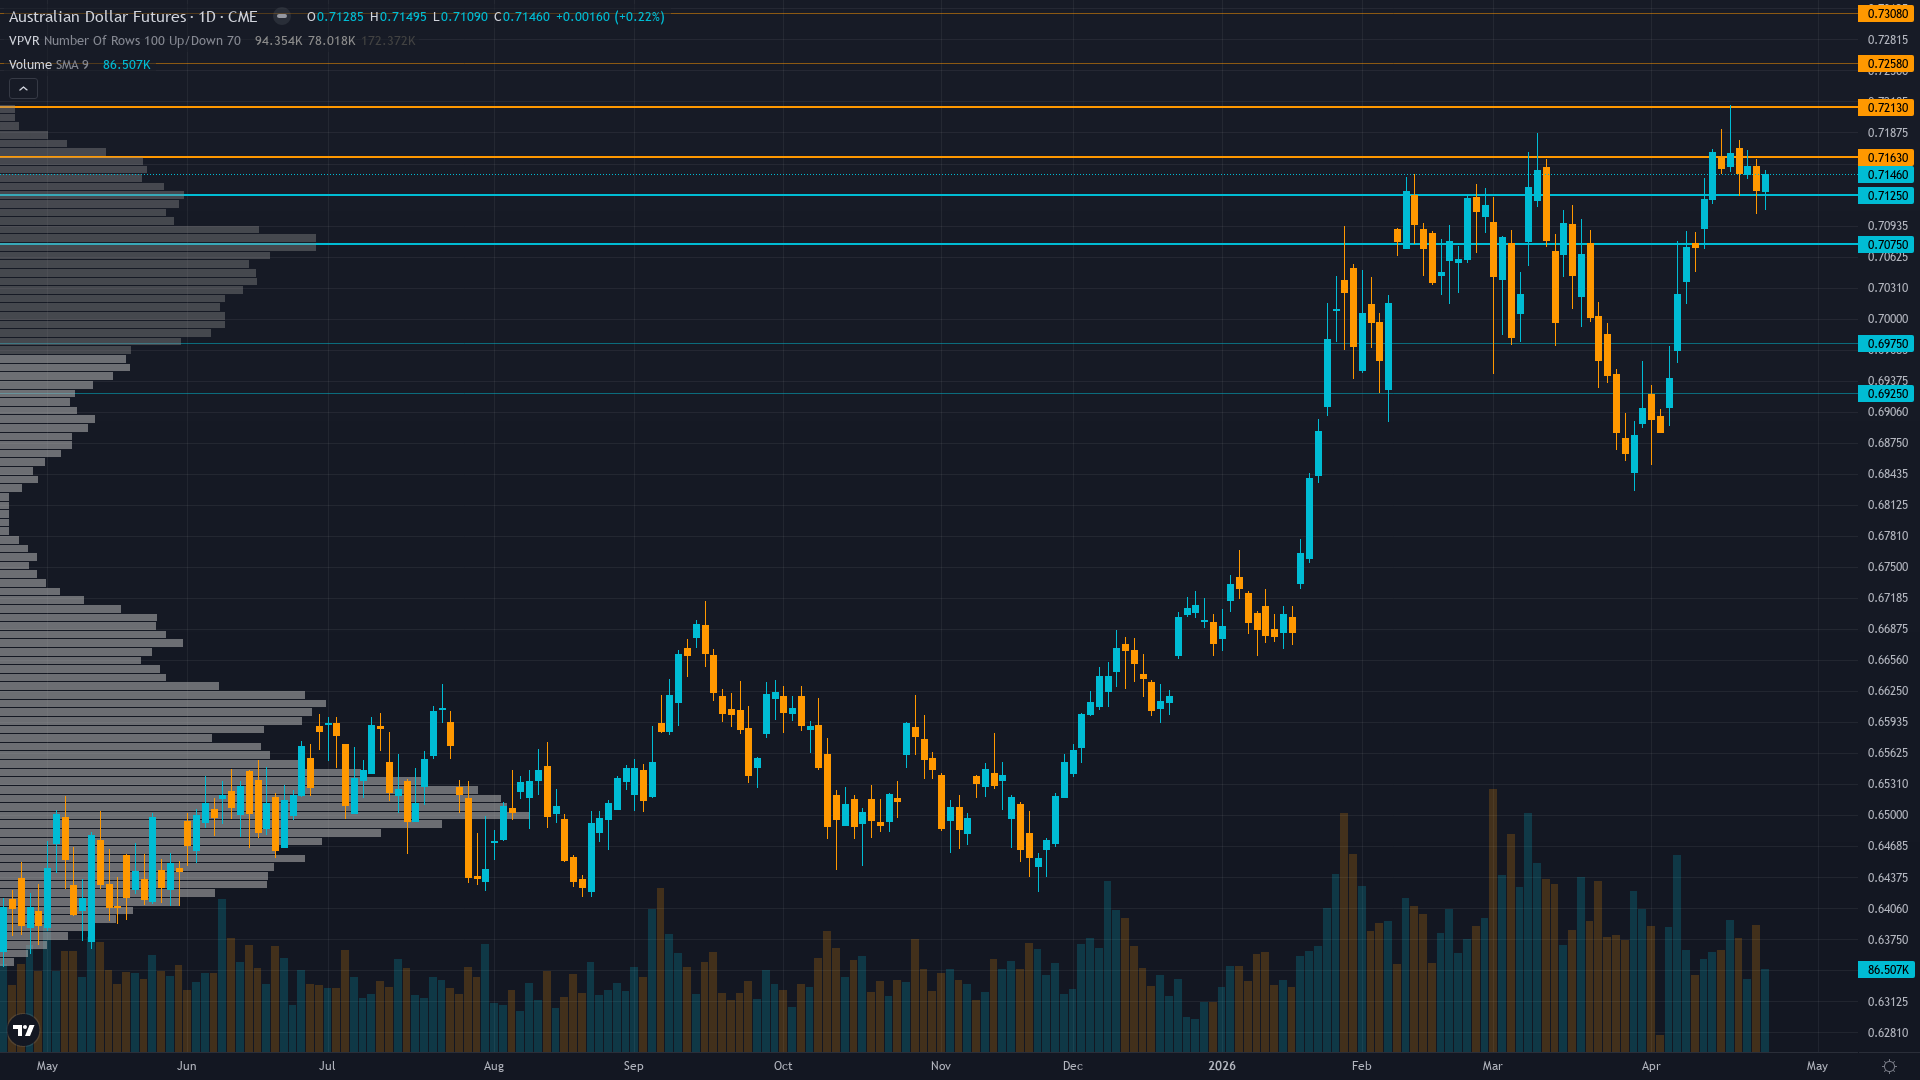
AUD/USD is trading at 0.7148, down 0.07% in a measured pullback. aussie dollar is consolidating, with price compressing into a narrower range as the market builds energy for its next move.
Trading at 0.7148 in mid-range between 0.7100 support and 0.7187 YTD resistance, RSI 58.19 neutral with room for upside, all moving averages bullish but price action consolidating after breakout attempt
At 6/10, trend strength indicates a solid directional lean without being overextended.
Support Architecture
Support levels for AUD/USD are defined by zones of prior institutional demand. The depth and frequency of prior tests at these levels determines their likely strength.
The strength of support depends on the current ranging with neutral bias in low-information week regime and volume profile at each level.
Upside Barriers
Resistance levels above 6A futures current price represent zones of historical supply. The significance of each level scales with the number of prior tests and the volume traded there.
The current consolidating regime influences how aggressively these resistance zones are likely to be tested and whether they hold or fold.
Confluence & Methodology
Confluence is the differentiator between a line on a chart and a level worth trading. For aussie dollar, the zones with the highest conviction are those validated across technical, institutional, and derivatives dimensions simultaneously.
Normalizing volatility at 54th percentile suggests 60-80bp daily ranges versus March's 150-200bp creating stable directional environment; breakout above 0.7187 or breakdown below 0.7100 requires sustained follow-through in current vol regime providing clearer conviction signals
Beyond Lines on a Chart
Our approach to key levels is designed to filter noise from signal. Six independent agents each assess the same price zones from different perspectives. A level confirmed by one discipline is interesting. A level confirmed by four or five is worth building a trade plan around.
This multi-discipline approach means the levels in our paid reports carry institutional-grade confluence — not just lines on a chart, but zones validated across every analytical dimension that matters.
Our paid reports include specific support and resistance levels identified by six specialist agents — technical structure, institutional positioning, options flow, fundamentals, sentiment, and economic analysis. Not just lines on a chart, but zones validated by multi-discipline confluence.
Start Free — Get the Market of the WeekFree weekly report · No credit card · Upgrade anytime


