30-Year Treasury Key Levels This Week — Support, Resistance & Confluence Zones
30-Year Treasury key levels breakdown: support zones, resistance zones, confluence and price structure.

Price Architecture
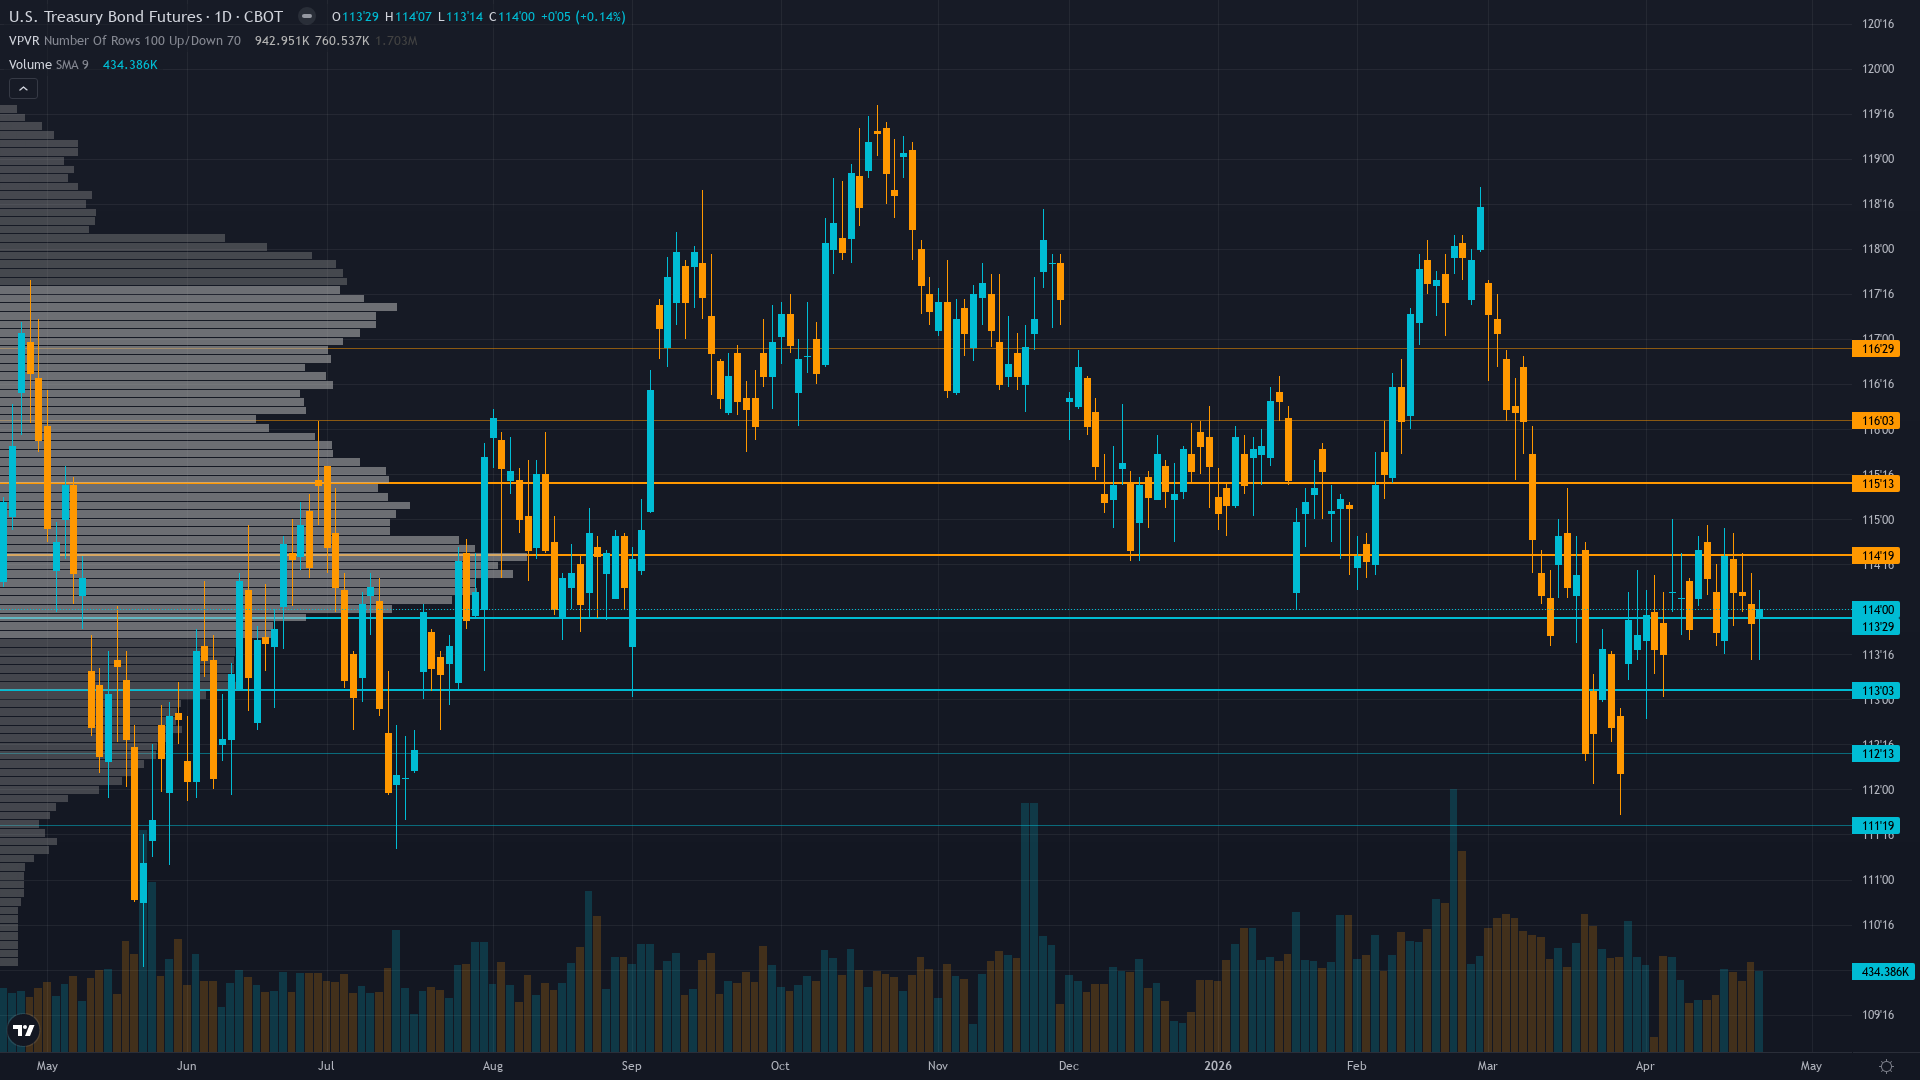
30-year Treasury holds at 114.09, off 0.27% in a modest retracement from recent levels. Treasury bond futures is in a consolidating within multi-week range market state, requiring careful assessment of current conditions.
Range-bound 111'15-122'11 consolidation with price at 114'09 in lower third below 116'20 midpoint; former 116.5 support now resistance with stalled momentum and declining open interest at 1.78M suggesting participant deleveraging
Trend strength is low at 3/10, indicating weak directional conviction and potential for range-bound behaviour.
Downside Protection
The downside architecture for long bond features support zones rooted in prior buying activity. These are not arbitrary lines but areas where real capital has previously been committed.
The reliability of support under TRANSITIONAL regime - VIX at 19.02 below 20 signals contained equity volatility yet bonds range-bound unable to rally despite traditional safe-haven conditions; regime reflects lack of clear directional catalyst with Fed on hold and data flow light creating neither risk-on nor risk-off dominance heading into binary April 28-29 FOMC event conditions is shaped by the interplay between volatility regime and historical volume at each level.
Resistance Zone Context
The upside path for T-bond futures is marked by resistance zones where prior selling activity created structural barriers. Clearing these zones requires either strong momentum or a shift in the fundamental picture.
In the current market state, resistance zones remain key decision points.
Analytical Convergence
The most actionable levels for 30-year Treasury are those where multiple analytical disciplines converge. When technical structure, institutional positioning, and options flow all point to the same zone, the probability of price reacting there increases meaningfully.
Volatility compression creating moderating environment; daily ranges compressing from 1.0-1.5 handles toward 0.5-0.75 handles as MOVE declines to 66.97; current 114.09 price in middle of 113.5-115.5 consolidation with April 28-29 FOMC creating near-term binary catalyst that could force breakout in either direction though pre-event calm suggests range persistence until decision
Our Multi-Agent Approach to Key Levels
The levels in our paid reports are generated by six specialist agents working in parallel. Technical analysis provides the structural framework, institutional data shows where capital is committed, options flow reveals hedging behaviour, fundamentals anchor levels to value, sentiment gauges crowd positioning, and economic analysis times the catalysts.
The output is a curated set of levels with institutional-grade validation — the kind of multi-dimensional analysis that hedge fund research desks produce, delivered at a fraction of the cost.
Our paid reports include specific support and resistance levels identified by six specialist agents — technical structure, institutional positioning, options flow, fundamentals, sentiment, and economic analysis. Not just lines on a chart, but zones validated by multi-discipline confluence.
Start Free — Get the Market of the WeekFree weekly report · No credit card · Upgrade anytime


