Platinum Key Levels This Week — Support, Resistance & Confluence Zones
Platinum key levels breakdown: support zones, resistance zones, confluence and price structure.

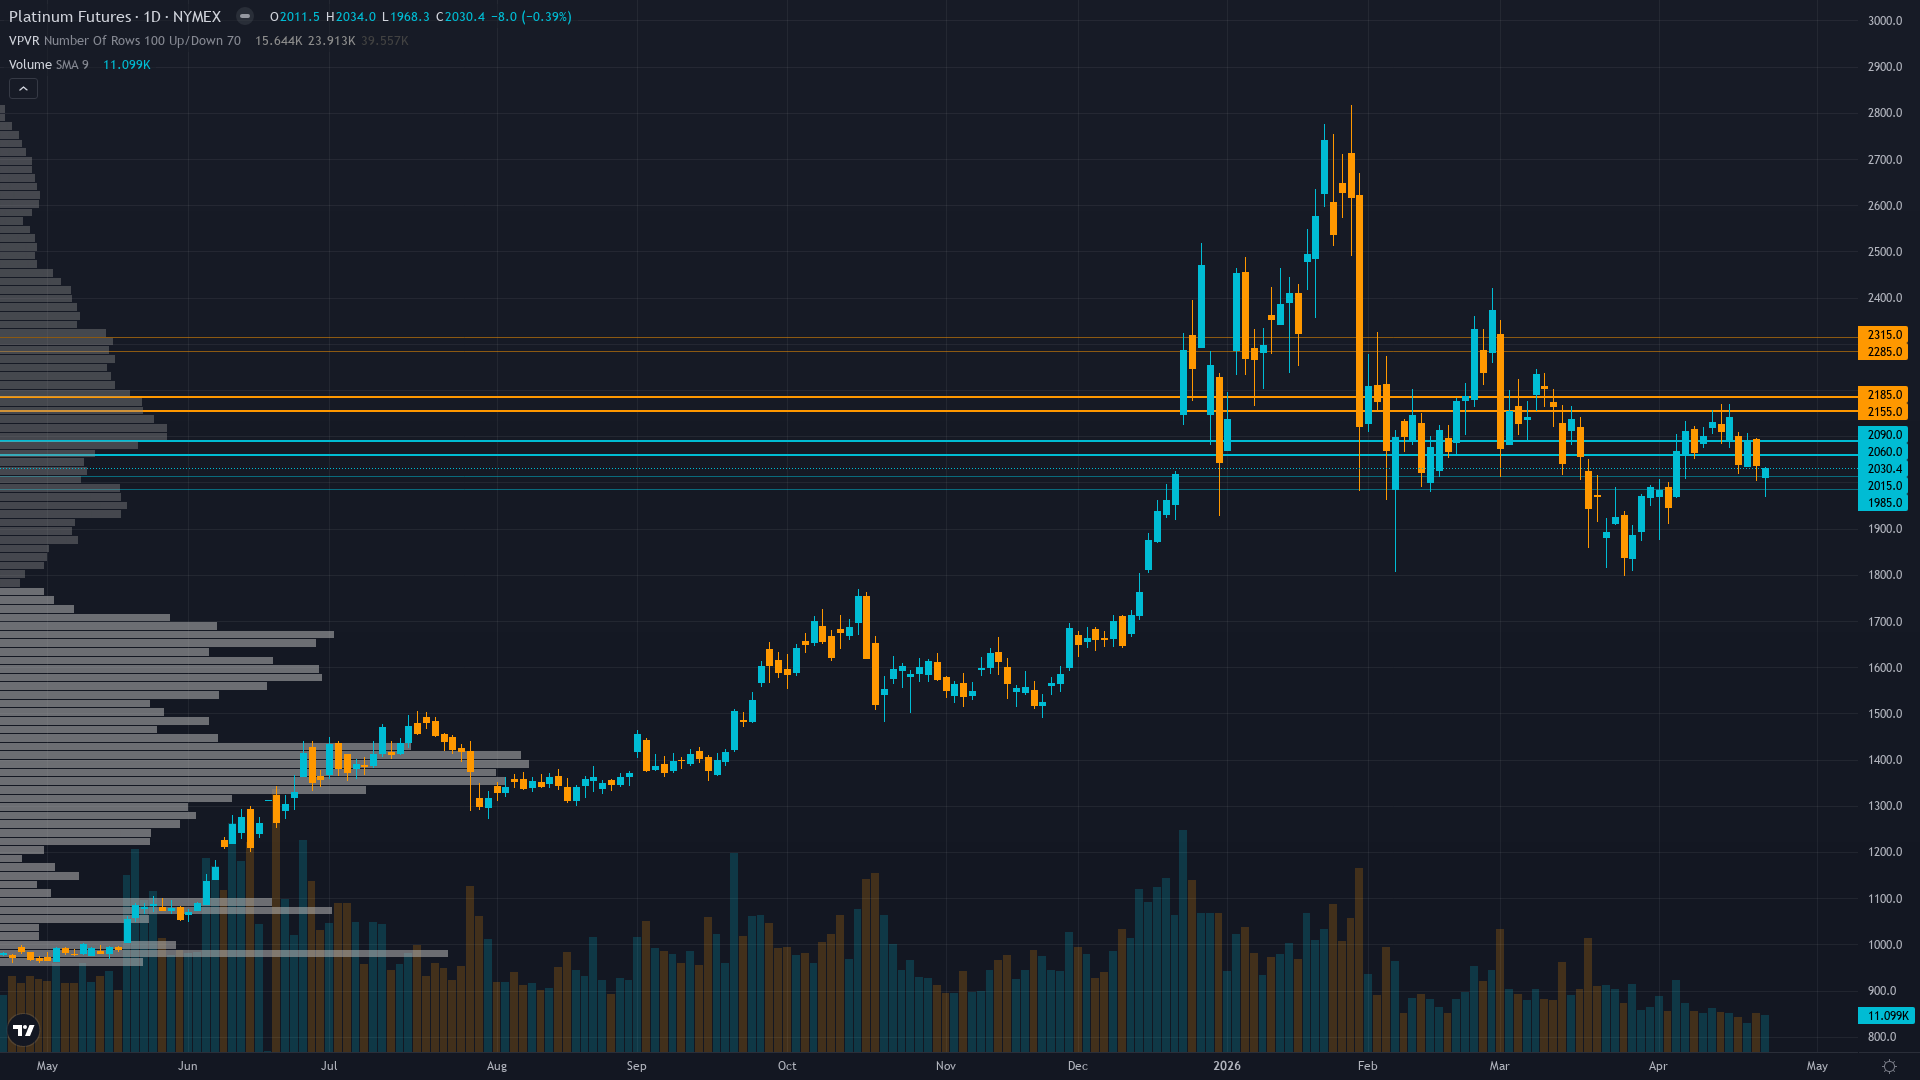
Price Architecture
platinum holds at 2030.4, off 0.39% in a modest retracement from recent levels. platinum futures is in a breaking down market state, requiring careful assessment of current conditions.
Strong breakdown accelerating with violation of $2,088 resistance-turned-support declining to $2,037 current price, testing critical $2,006 immediate support with RSI turning up from oversold but momentum indicators showing 'Strong Sell' readings
Trend strength sits at 4/10, reflecting moderate directional pressure without clear dominance.
Downside Protection
The downside architecture for PL futures features support zones rooted in prior buying activity. These are not arbitrary lines but areas where real capital has previously been committed.
The reliability of support under TRANSITIONAL with RISK-OFF characteristics - VIX at 18.71 (below 20 threshold) signals surface calm but geopolitical risks from Iran conflict persist, Fed rate cut expectations pushed back to late 2026 creating hawkish repricing, and FOMC meeting in 2 days creates binary event uncertainty conditions is shaped by the interplay between volatility regime and historical volume at each level.
Resistance Zone Context
The upside path for platinum price is marked by resistance zones where prior selling activity created structural barriers. Clearing these zones requires either strong momentum or a shift in the fundamental picture.
In the current market state, resistance zones remain key decision points.
Analytical Convergence
The most actionable levels for platinum are those where multiple analytical disciplines converge. When technical structure, institutional positioning, and options flow all point to the same zone, the probability of price reacting there increases meaningfully.
High but contracting volatility suggests daily ranges of $60-100 expected versus $150-200 during peak January-March phase; breakdown below $2,000 would likely expand ranges to $80-120 on stop-triggered selling while reversal requires sustained reclaim of $2,088 with declining volatility
Our Multi-Agent Approach to Key Levels
The levels in our paid reports are generated by six specialist agents working in parallel. Technical analysis provides the structural framework, institutional data shows where capital is committed, options flow reveals hedging behaviour, fundamentals anchor levels to value, sentiment gauges crowd positioning, and economic analysis times the catalysts.
The output is a curated set of levels with institutional-grade validation — the kind of multi-dimensional analysis that hedge fund research desks produce, delivered at a fraction of the cost.
Our paid reports include specific support and resistance levels identified by six specialist agents — technical structure, institutional positioning, options flow, fundamentals, sentiment, and economic analysis. Not just lines on a chart, but zones validated by multi-discipline confluence.
Start Free — Get the Market of the WeekFree weekly report · No credit card · Upgrade anytime


