AUD/USD Forecast This Week — Outlook, Drivers & Key Levels
This week's AUD/USD outlook: key drivers, volatility context, risk-opportunity assessment and the week ahead.

This Week's Starting Point
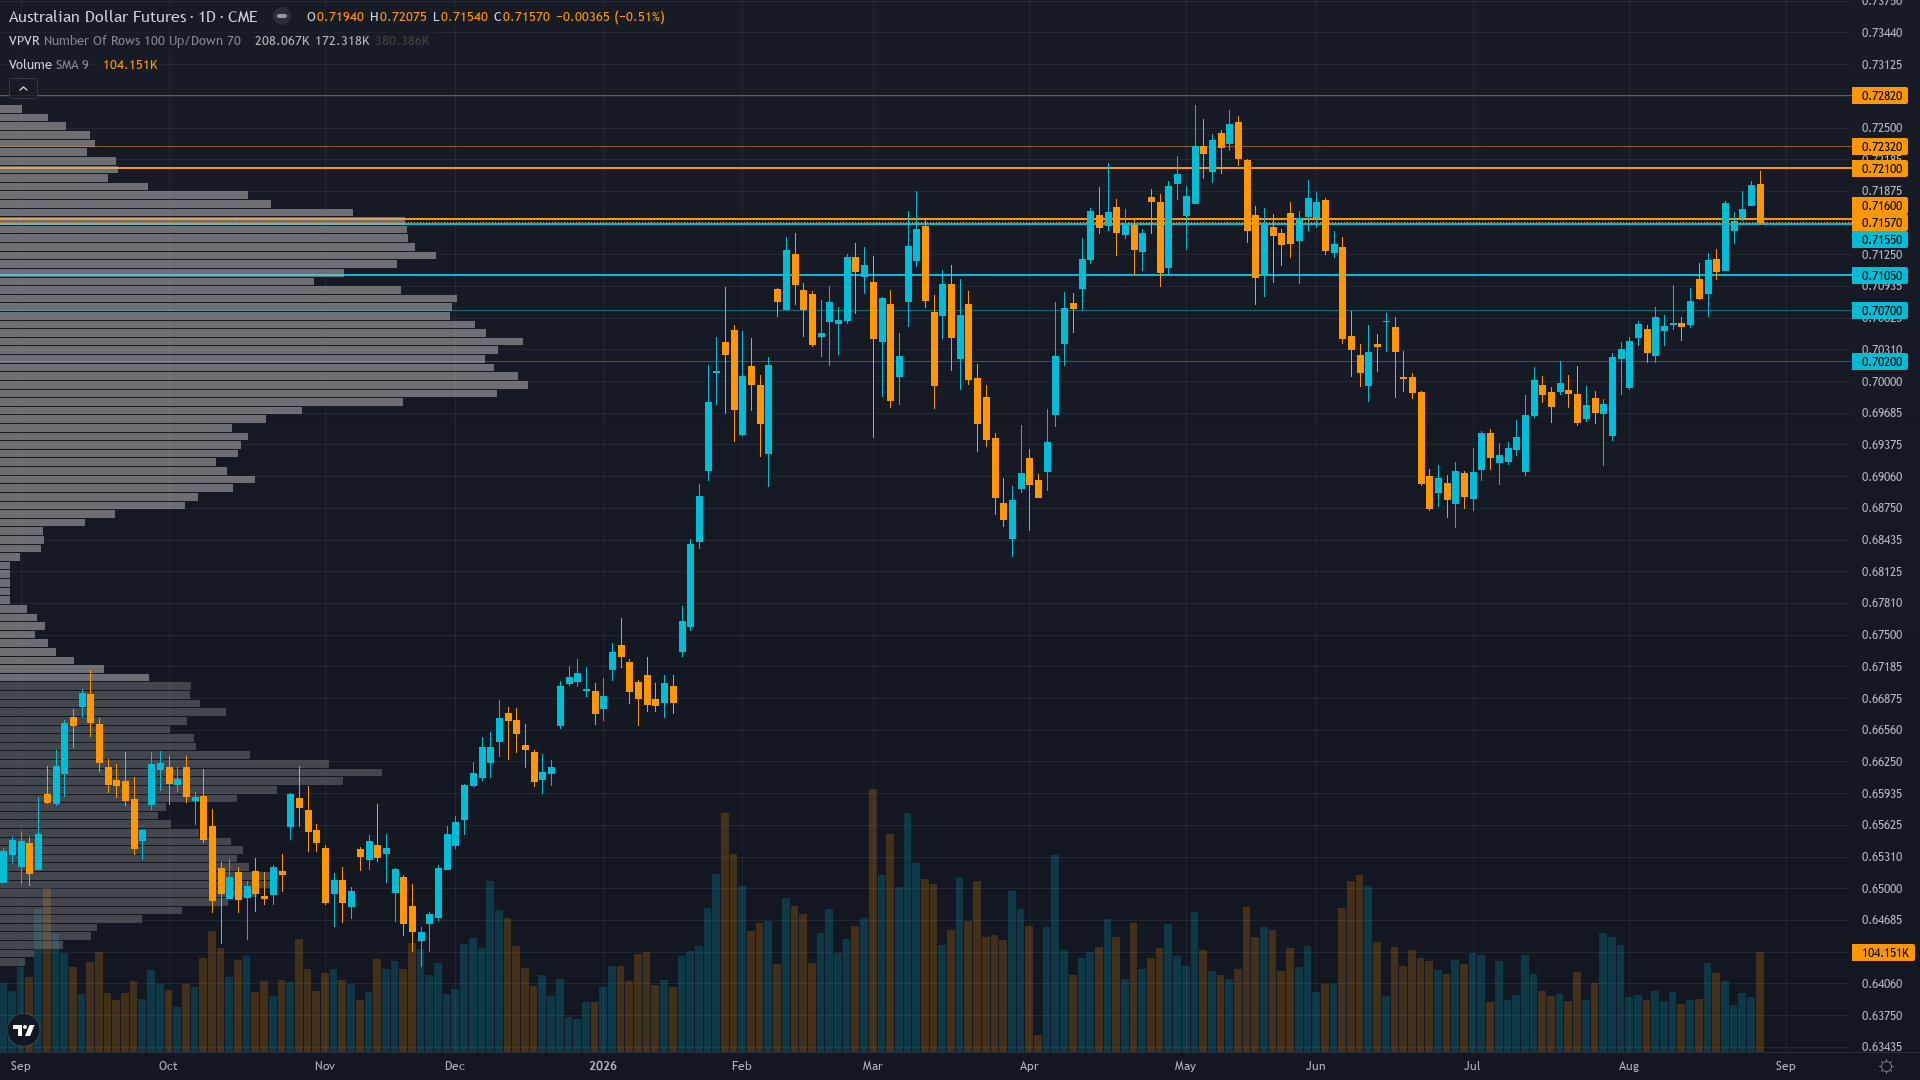
AUD/USD is trading at 0.7157, down 0.46% in a measured pullback. Price action in aussie dollar has compressed into a consolidation pattern, typically a precursor to a directional breakout.
Market consensus cautiously bullish on AUD supported by the 72bp RBA policy advantage and elevated commodity prices, but the rally has stalled near 0.7180 resistance awaiting China PMI and Australian GDP this week to determine whether the August rally extends or reverses
Forces in Play
Primary driver: AUD consolidating near 10-week highs at 0.7157 after a strong August rally (+3.44% monthly) driven by external USD weakness from the US Treasury bond buyback announcement on Aug 21 and the RBA's 72bp policy advantage (4.35% vs Fed 3.63%), but momentum has stalled in a 0.7110-0.7180 range awaiting binary catalysts this week
Secondary factor: Upcoming Australian Q2 GDP data on September 2 (est 1.6% YoY vs prior 2.5%, est 0.3% QoQ) represents a critical domestic fundamental test — a print materially below 1.6% YoY would validate KPMG's assessment of 'growth remaining weak throughout 2026' and undermine the RBA hawkish divergence narrative that has supported AUD
Additional influence: China NBS Manufacturing PMI (Aug 31, est 49.7 vs prev 49.2) and Non-Manufacturing PMI (est 49.5 vs prev 49.0) are the first catalysts this week — both expected to remain in contraction territory (below 50), which would confirm persistent weakness in Australia's largest trading partner and cap AUD upside near 52-week highs
Economic backdrop: TRANSITIONAL: VIX at 15.13 indicates neutral risk appetite with mild complacency, US Treasury curve steepening (+39bp 2s10s, +49bp 10s30s), HY credit spreads at 275bps showing moderate stress, USD consolidating — mixed signals with no clear macro tailwind for AUD beyond the RBA policy divergence
Fundamental assessment: AUD modestly undervalued (~3-5% below PPP fair value of 0.72-0.73), supported by RBA 72bp policy advantage (4.35% vs Fed 3.63%) and elevated commodity prices, but Q1 current account deficit at AUD 27.1B (largest since 2016) and declining terms of trade (111.90 Q2 from 117 Q1) represent accumulating structural headwinds
Technical Landscape
Bullish trend intact above 50-day MA (0.7045) and 200-day MA (~0.6900), but RSI at 68.13 approaching overbought territory, price consolidating in 0.7110-0.7180 range with diminishing upside momentum after the Aug 21 USD-driven breakout stalled at 0.7180 resistance
Trend strength registers at 6/10, suggesting meaningful but not extreme directional bias.
Risk-Reward Assessment
Primary risk: Australia Q2 GDP on September 2 prints below the consensus estimate of 1.6% YoY (from 2.5% prior), validating KPMG and Westpac assessments of sharply decelerating economic momentum and undermining the RBA rate divergence thesis that has been the primary structural support for AUD, triggering a pullback toward 0.7045-0.7110 (Probability: medium)
Primary opportunity: China PMI data on Aug 31 surprises above 50, breaking three consecutive months of contraction and signaling stabilization in Australia's largest export market, combined with a GDP print that holds at or above 1.6% YoY validating the RBA's tightening bias, triggering a squeeze on the -44,455 net speculative shorts and pushing AUD through 0.7180 resistance toward the 52-week high at 0.7257 (Timeframe: 48-72 hours after China PMI (Aug 31) and Australian GDP (Sep 2) resolution, contingent on both catalysts aligning positively)
This week's edge: Below Min Signal threshold — no directional call. The weighted signal of +0.60 falls below the FX_MAJOR threshold of 1.1, mandating NO CALL per Rule 2. The key blindspot the desk has identified is the divergence between AUD's price strength (+3.44% monthly) and deteriorating domestic fundamentals (Q1 current account deficit at AUD 27.1B, terms of trade declining from 117 to 111.90, KPMG forecasting weak growth through 2026 with Q2 GDP estimate of 1.6% YoY representing a sharp deceleration from 2.5%). This week brings back-to-back binary catalysts (China PMI Aug 31, US ISM Sep 1, Australian GDP Sep 2) creating genuine two-way uncertainty that prevents directional conviction. Additionally, the seasonal pattern (AUD weak through late August into September per MRCI) is being defied this year, creating asymmetric reversion risk if catalysts disappoint. The desk acknowledges the bullish structural lean based on RBA policy divergence (4.35% vs Fed 3.63%) and AUD undervaluation (3-5% below PPP fair value), but lacks the signal strength and catalyst proximity to convert this into a directional call above the Min Signal threshold.
Risk Environment
With vol at the 42th percentile over 90 days, AUDUSD is in a measured regime that doesn't require unusual adjustments. Volatility is stable, with realised vol holding steady across timeframes. This equilibrium can persist but eventually resolves into expansion or contraction.
Normal volatility at 42nd percentile with 20-day realised vol at 6.7% annualised suggests 45-65bp daily ranges — stable but uninformative environment until this week's binary catalysts resolve; breakout above 0.7180 or breakdown below 0.7110 needs sustained follow-through from China PMI or Australian GDP data
Looking Forward
All eyes turn to China NBS Manufacturing PMI (Aug) — est 49.7 vs prev 49.2, critical for AUD commodity demand thesis as China accounts for ~75% of Australia's iron ore exports on Monday 31 August, which carries enough weight to force a decisive directional move.
The week ahead for aussie dollar hinges on whether the prevailing consolidating regime can absorb the scheduled catalysts without a regime shift.
This analysis covers one dimension. Our full weekly report combines six specialist agents into a single actionable briefing with directional bias, key levels, and risk-opportunity matrix.
Start Free — Get the Market of the WeekFree weekly report · No credit card · Upgrade anytime