AUD/USD COT & Institutional Positioning — Smart Money Analysis
AUD/USD institutional positioning: COT data, sentiment analysis and smart money flow assessment.

The Institutional Landscape
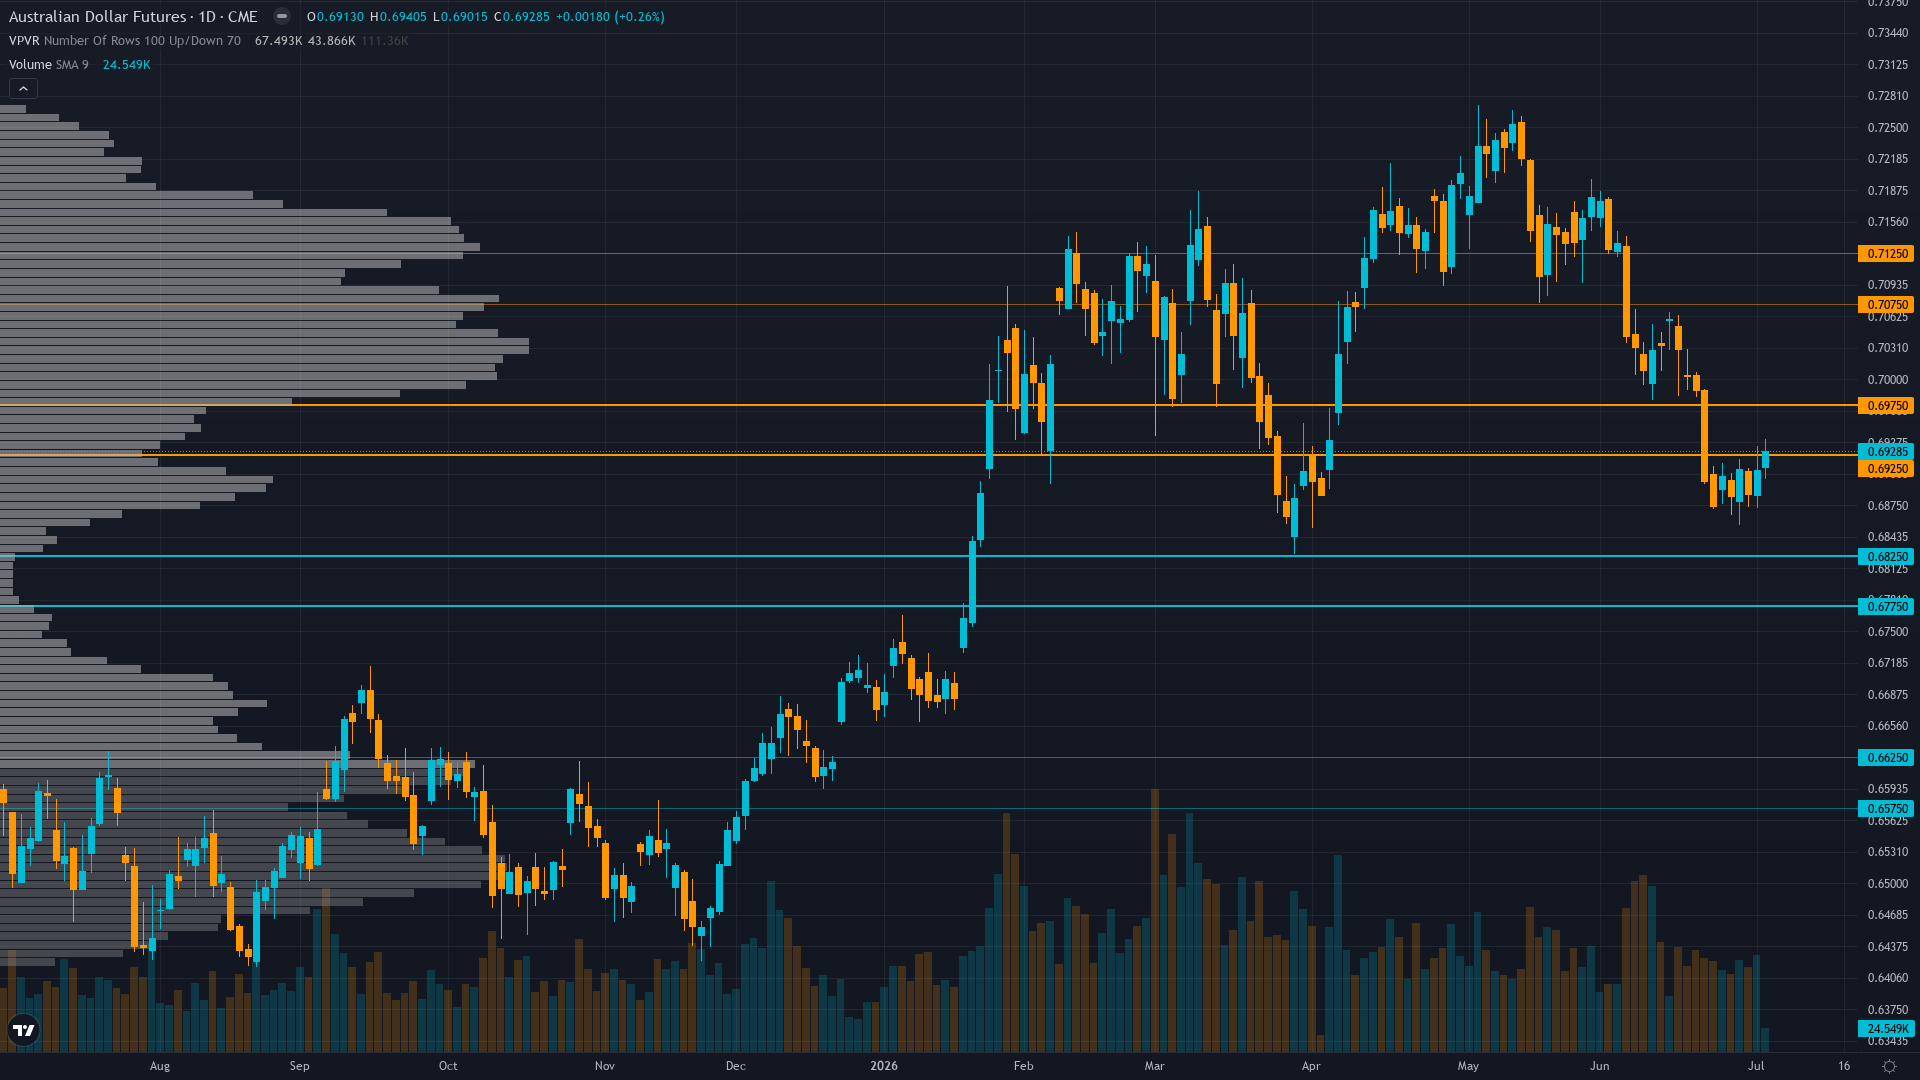
At 0.6939, AUD/USD has inched 0.23% higher in a measured advance.
COT net shorts at -13.0K contracts per June 23 data representing normalization from prior record longs but not at extreme crowding levels that would signal imminent reversal, positioning appears balanced
Market Consensus vs Our Analysis
Market consensus: Market consensus correctly prices consolidation in low-information environment with no fresh catalysts, AUD trading at 0.6939 reflects balanced two-way risk ahead of August 11 RBA decision
Primary driver: RBA June 20 hold at 4.35% now 15 days old creates low-information environment with no fresh weekly catalyst while Q1 current account deficit at AUD 27.1B (largest since 2016) represents structural fundamental deterioration that has been priced for 33 days but remains unresolved
Contrarian Assessment
Desk maintains minimum BEARISH conviction on structural deterioration (Q1 current account deficit largest since 2016, no fresh catalyst for 15+ days) while market positioning at 0.6939 consolidation with all disciplines aligned bearish suggests similar analytical assessment creating minimal divergence as both desk and market recognize low-information environment awaiting late July data or August RBA resolution
Sentiment & Positioning
Sentiment around aussie dollar is neutral, with no extreme positioning on either side. This balanced state often resolves when a catalyst breaks the equilibrium.
Options Market Signal
Insufficient current data for 6A options due to thin futures options liquidity limiting analytical value
Putting It Together
In summary, the positioning picture for AUD/USD reflects neutral conviction levels set against a consolidating market backdrop. Trend strength at 4/10 paints a picture of a market with some direction but lacking strong conviction. The interplay between smart money activity, retail sentiment, and options market signals will shape how this positioning resolves.
This analysis covers one dimension. Our full weekly report combines six specialist agents into a single actionable briefing with directional bias, key levels, and risk-opportunity matrix.
Start Free — Get the Market of the WeekFree weekly report · No credit card · Upgrade anytime



